Compare Shopify reports: Check your filters

Before you compare Shopify reports, check that the dates, customer groups, and sales channels match your question. Reports in By the Numbers now use the same filter buttons as dashboards. Click the × on a changed filter to reset it when you want to test a broader view.
Suppose your dashboard suggests sales are holding steady, but a report makes the week look weaker. Before changing a promotion, check whether you are looking at the same part of the business. A report limited to one customer group can tell a different story from a storewide view.
Match the question before the numbers
Write down what you want to compare before trying to explain a difference. “Did average order value change during our promotion?” gives you a clearer starting point than “How are we doing?”
A dashboard brings report summaries together, while a detailed report lets you examine a particular measure. Moving between them is useful, provided you keep track of what each view includes.
Start with the metric name, then check the dates and the comparison period. A promotion weekend and a full month answer different questions, even when the metric is the same. Make sure the earlier period is useful for the decision you are making.
Next, check the customer group and channel where those controls are available. Comparing a narrow audience with a broader one can hide the difference you meant to investigate. Matching the settings gives you a better basis for comparison; different measures can still produce different totals.
For help choosing which report answers your question, use the Shopify analytics guide.
Start with the filter bar
Open Reports in By the Numbers and choose the report you want to investigate. Above the results, review the date range and the other controls offered by that report. Many reports also support a comparison period and a customer segment.
The buttons now follow the same design as dashboard filters. Matching button designs do not mean separate views have matching selections. If you already use a dashboard to review your store, look for those familiar controls on reports.
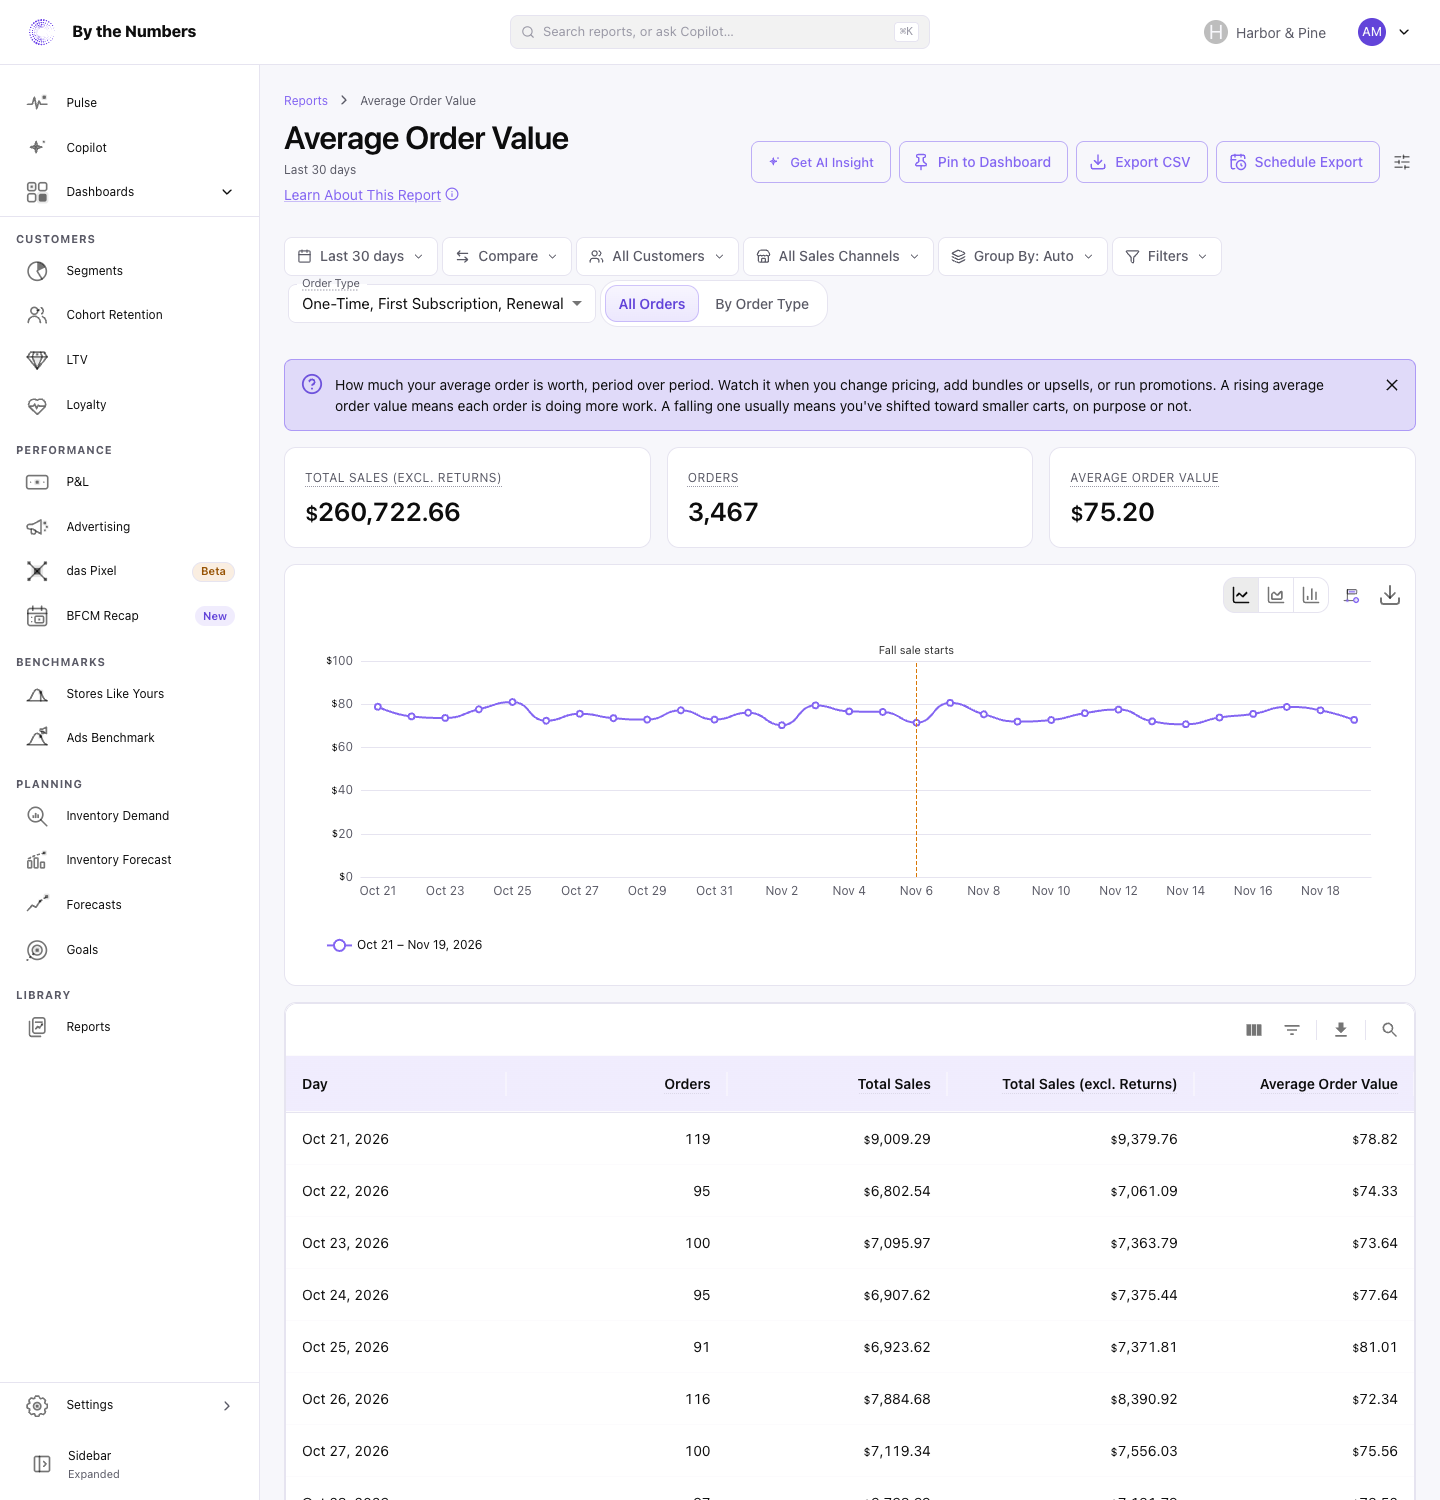
Choose the dates first, then add a comparison if you need to see change against an earlier period. Where a customer control is offered, check whether it includes the group you intend to review. Read the selected labels before drawing a conclusion from the chart.
With a comparison on, headline figures show change against the comparison window, and breakdown tables show change per row. Use those together to see whether a headline movement is spread across the period or concentrated within it.
The help guide to running a report walks through the available controls and where to find them. The screenshot above shows the filter bar, rather than a changed filter's reset button.
Reset a changed filter to test your question
Click the × on a changed filter when you want to reset that selection. Then read the selected labels again before comparing the result with your earlier view.
Imagine you are reviewing average order value during a promotion, with a particular customer segment selected. You want to know whether the pattern extends beyond that group. Note the current selection, reset the changed customer filter, and check the broader view.
Keep the dates and comparison period fixed while you do this. If you also change the time window, you make it harder to tell which change affected the pattern. Apply the same discipline when investigating a particular sales channel where that filter is offered.
If the narrower view looks different, treat that as a question to investigate. Review what that audience was offered, which products were available, and whether the message matched their needs. A difference between views does not establish that the promotion caused it.
Average order value also needs context: larger baskets can sit alongside fewer orders. Decide whether your next question concerns basket size, order volume, or the audience reached before changing the offer.
Keep the comparison useful next time
Bookmark the report once its settings match the question you want to revisit. Report links keep their filters, so sharing the link helps a colleague return to that view.
Alongside the link, record the question, the observation, and the next check. For example, note that you will review a promotion's message before repeating it for the same customer group. That gives the next review a clear purpose.
For a recurring team review, the monthly reporting pack helps organize the questions and follow-up. If the task still involves repeated manual work, assess which Shopify reporting task to replace first.
The ecommerce reporting page explains the wider reporting tools. Start with a report you already use: check its filters, reset a changed selection, and choose the next question from what you see.
Keep reading
If you want the full picture on Shopify analytics and reporting, start with our complete Shopify analytics guide.
Related reading: Set up Shopify reports from a conversation, Shopify reports limitations: What to change and The New By the Numbers Arrives December 8.
By the Numbers builds this into the dashboard. See Shopify analytics reporting.
See what is working in your Shopify store
By the Numbers turns your store data into reports, segments, and forecasts.
- AI-powered analytics
- Customer segmentation
- Predictive forecasting
- One-click Shopify install