Which customer groups came back this month?

To review Shopify customer retention by month, start with the question you want answered. Which groups came back during October? Or are newer customers returning as often as earlier customers did at the same age?
Cohort Retention in By the Numbers now lets columns follow the calendar, using your Group By period. You can see the share of each first order group returning in the same calendar period. That gives you a way to review a particular month's activity across groups before deciding what to investigate.
Choose the question before the view
A cohort is a group of customers with a shared starting point, such as their first purchase month. Keeping those groups separate helps you see differences that a store's overall retention rate can hide.
Calendar time and time since first order answer different questions. Imagine customers who first bought in January and others who first bought in February. A March calendar column shows what both groups did during March, even though the January buyers have been customers longer.
A column showing the month after first purchase compares those groups at the same age. For January buyers, that means February. For February buyers, it means March.
Choose calendar time when your question concerns a promotion, season, or stock problem during a particular month. Choose time since first order when you want to compare how groups behave as they get older. The calendar view helps locate a shared moment; the age comparison helps you judge whether newer groups are returning more often.
Switch the report to calendar months
Open Cohort Retention under Customers. For a monthly review, choose Month in Group By, then select Calendar Months beside Months Since First Order. The columns follow your chosen grouping period.
The screenshot below shows where to switch. Months Since First Order is still selected, and Calendar Months sits beside it above the chart.
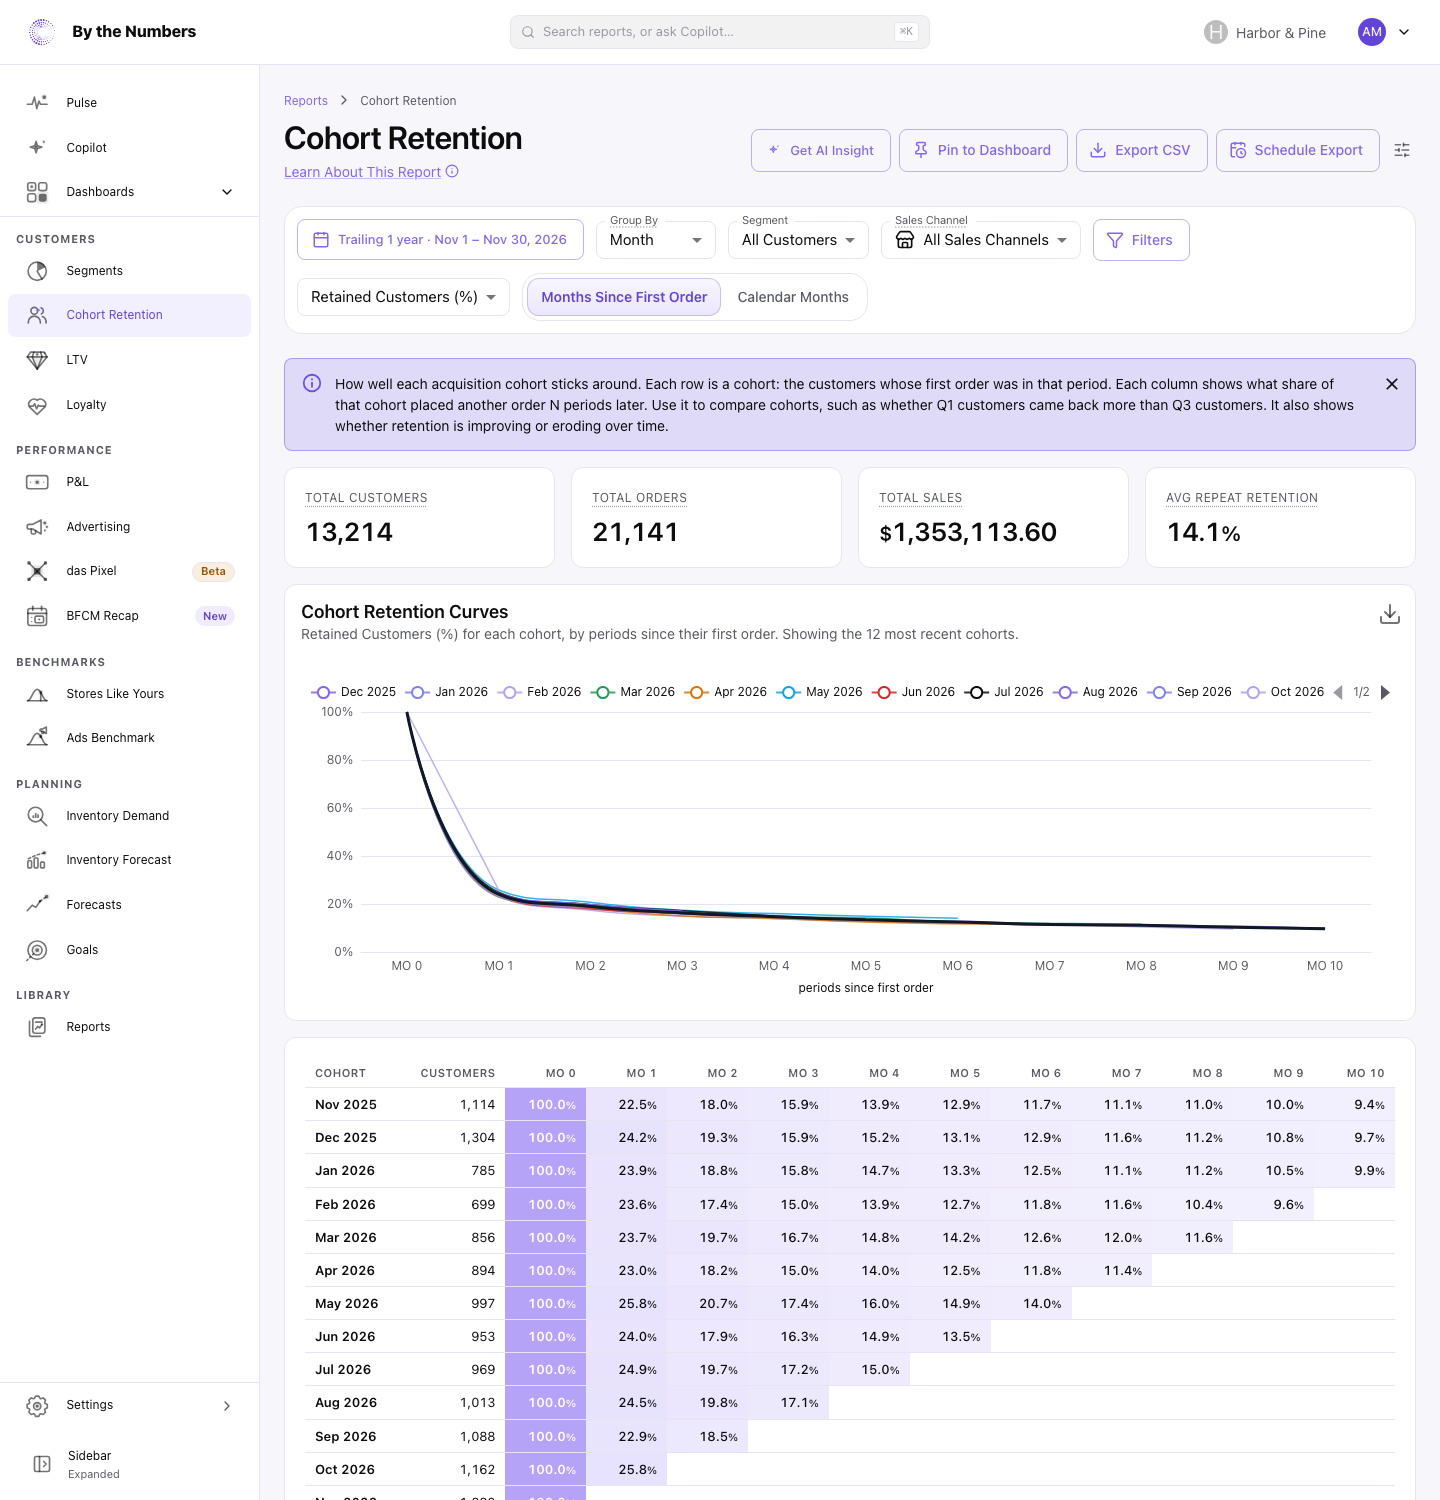
Use the Cohort Retention help guide for the report's steps and settings. Start with a month you have a reason to review, rather than searching the grid for its brightest cell.
Read one month across customer groups
Compare finished months before judging a rise or fall. A month still in progress has had less time for purchases than a finished month.
Read down a calendar column to see how different first purchase groups behaved during that month. Read across a row to follow one group's activity through the calendar.
Imagine reviewing a holiday promotion. You want to know whether customers acquired before the sale returned during the promotion month. The calendar view puts that month in front of you across the earlier groups.
If several groups show stronger activity then, check what they experienced at that time. An offer, a restocked product, or a seasonal need could be worth investigating. If the change appears in one group, look at what made that group's first purchase experience different.
Treat these as questions to investigate. Customers in a calendar column have different amounts of time behind them, so the highest share does not automatically identify your best acquisition month. Return to comparisons at the same age before judging whether one group keeps coming back more reliably.
Turn the pattern into one investigation
Choose an action that could explain the pattern you noticed. A broad dip during one month might prompt a stock availability check. A weaker response from one group might prompt a review of its first offer or the messages it received afterward.
Look at your campaign notes, customer feedback, and product availability before deciding what to change. The grid shows buying activity; it cannot tell you why a customer returned or stayed away. A rise during a promotion does not prove that the promotion caused those purchases.
If you suspect your reminder arrives at the wrong moment, use our second order follow-up guide to plan a timing test. If the issue concerns service or the offer itself, choose a relevant customer retention strategy instead. Change one thing you can evaluate, and write down the question it is meant to answer.
Check progress with the right comparison
Keep monthly buying activity separate from whether a customer has bought again by a deadline. Someone may return during February and place no order during March. They remain a repeat buyer, but that does not mean they were active in both months.
Our guide to reading ecommerce cohort tables explains that distinction and how to compare groups fairly. It matters when you decide whether a change helped customers return sooner or encouraged them to keep buying later.
Use the cohort analysis reports to start with the question your review needs to answer. Choose a calendar month, note which groups changed, and pick one explanation to check. Then use the same comparison when you review what happened next.
Keep reading
If you want the full picture on cohort analysis and retention, start with how to read your cohort retention curve.
Related reading: Ecommerce second order rate: When to follow up, Cohort analysis: Read ecommerce retention and Customer Churn Rate Benchmarks.
By the Numbers builds this into the dashboard. See cohort analysis.
See what is working in your Shopify store
By the Numbers turns your store data into reports, segments, and forecasts.
- AI-powered analytics
- Customer segmentation
- Predictive forecasting
- One-click Shopify install