The Shopify Cohort Analysis Guide That Retains customers

E-Commerce is a fun game. But the game isn’t fun when your customers keep leaving you. Want to avoid this? A Shopify Cohort Analysis can do that. 

But more specifically, a Shopify cohort analysis that will focus on retention. 

There’s a reason store owners are searching this up. There’s too much value in this analysis.

Yes you heard that right, there’s too much value in this analysis. But only if you discover how to use it.

That value that translates to more high quality customers. Understand the customer, and see their real desires.

Knowing how to retain your customers lets you stop running around, and pulling your hair out because you don’t know how to make them come back.

I’d rather have you use your hands to launch better campaigns and products than pull out your hair. Making the right moves lets you avoid missing out on those winning customers that guarantee you millions. 

Right now, you’re going to learn what a Shopify Cohort Analysis is, the benefits it brings, and how to use it to become the best in your industry.

What is a Shopify Cohort Analysis?

Before you learn how to use the analysis, let’s make sure you understand every angle of it. 

A Shopify Cohort Analysis takes customers, and groups them by a characteristic to study their retention month by month.

To study retention, the best characteristic to group your cohorts by is by the month they became a customer (first purchase).

Why is the month of a customer’s first purchase the best way to group them?

  1. Behavioural patterns: What’s the difference between customers you acquired during the holidays vs other months? Do the holiday customers behave differently in terms of purchase frequency? Do they have a behaviour of purchasing in high volumes during the holidays?
  2. Marketing and Sales Impact: This can show a correlation with marketing efforts. What marketing campaigns helped retain more customers? How can we optimize our campaigns to increase our retention?
Here’s an example of what a detailed Cohort Analysis looks like (titled “Cohort Retention”). This report shows the month your customer made a purchase. Then it will show how often these group of customers came back to repurchase on a month-by-month basis.
Shopify Cohort Analysis

Let’s go through the definitions of the columns:

  • Cohort: The group of Customers that made their first purchase in a given period.
  • Cohort size: The number of distinct Customers in a Cohort.
  • Months After First Order: The number of Customers that returned to purchase from your Shop again after their first purchase.
  • Total sales: The total sales of this cohort (Gross Sales – Discounts – Returns + Taxes + Shipping Charges)
  • Orders: The total number of orders placed by the Cohort.
  • AOV (Average Order Value): The Total Sales (not including returns) divided by the number of orders.
  • Frequency: This is the average number of orders placed by each customer in the Cohort.
  • Customer Value: This represents the average monetary value each Customer brings to your business. It is the average order value multiplied by the frequency.
  • Average LTV (Lifetime Value): This represents the average monetary value each Customer brings to your business over their lifetime.
It’s important to point out that as time goes on, it’s normal to see your retention fall. This is why it’s always important to advertise your store so that new customers come.

Why Is the Shopify Cohort Analysis Important? 

There are three stages for every customer when they buy from a business

Shopify Cohort Analysis

You first make a sale to your customer. 

After, if your customer likes your product, you achieve the fulfilment stage. 

Then, if they really love it, you hit the retention stage which then starts the cycle back to the sale.

Why am I showing you this? 

It’s important to understand that your current customers actually generate you more money than new customers. Your current customers have already bought from you, there’s no obstacle to pass to get them to buy again. 

The sales process is way easier because they know you now. They’re familiar with your product. 

Here are a couple of interesting studies 

  1. The cost of acquiring new customers can be between 5-25x more than the cost of retaining current customers (Harvard Business Review)
  2. Increasing retention costs by 5% saw a profit increase of 25%-95% (Bain and Company)
  3. Your top 10% of customers spend more than the other 90% (Harvard Business Review) 

I hope you can see from the above that there is a pool of instant sales waiting to be tapped into. 

I’m serious, if you did a detailed analysis, you would see that there’s MASSIVE amounts of unrealized sales just waiting to be tapped into for EACH COHORT GROUP. 

Take a look below and you’ll see the unrealized sales in each cohort shown from the Cohort Retention Report I showed earlier.

Shopify Cohort Analysis

This analysis shows you who the high performing customers are and who’s really making the store money

The Cohort Analysis will show you who to target, but what do you do from there? 

Logo By the Numbers

By the Numbers

Empower your business with our Shopify Data Driven App

Shopify App Store
★★★★★ 5/5
  • ✔ Know Your Audience Behavior
  • ✔ Deep Customer Segmentation
  • ✔ Retarget With Integrations
  • ✔ All The KPIs & Reports You Need

The Problem With Shopify

Yes, there’s an issue. However, before we get to that, I’ll show you how to access the report on Shopify

1- Click on
Analytics > Reports once you’ve accessed your Shopify Store.

2- Click on or search for Customer Cohort Analysis

Shopify Cohort Analysis

Below you’ll see Shopify’s Cohort Retention Report (as you can see it’s titled differently but it still serves the same purpose)

Shopify Cohort Analysis

So what’s the issue with this report? There’s a lack of flexibility in it.

The purpose of you even wanting to look at this report is to study your customers. But if you’re going to look at a report and dry your eyes out, at least make sure it’s an insanely detailed report

Here’s the issue with this report

  1. Lack of Segmentation: The most important part about e-commerce analytics. If you don’t separate your audience into separate groups, you’ll understand nothing about your audience. What if you wanted to study your retention performance for the past two years for your at-risk customers? You wouldn’t be able to. Shopify only lets you group customers geographically which doesn’t give you a full picture.
  2. Lack of Cohort Performance Detail: Do you know what the LTV of each of your cohort is? Total sales? AOV? You wouldn’t be able to see this with this report. 
You should be able to see every detail of your cohort which is why it’s important to look for an analytics app that shows you these details. In the next section, I’ll show you how to use an analysis like this to your advantage. 

How to Use this Analysis to Your Advantage

 Here’s what you found out so far

  • You know what a cohort analysis is and what it does. 
  • You know why it’s so important for Shopify owners to understand it. 

Now I’m going to show you how to actually use this information and set you on the right path. 

Here’s an example of a Cohort Analysis Report from By the Numbers 

Shopify Cohort Analysis

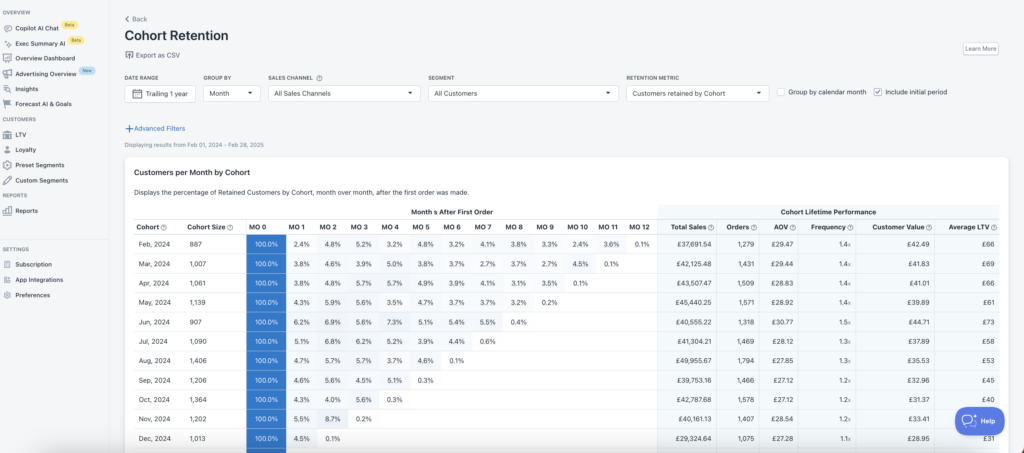
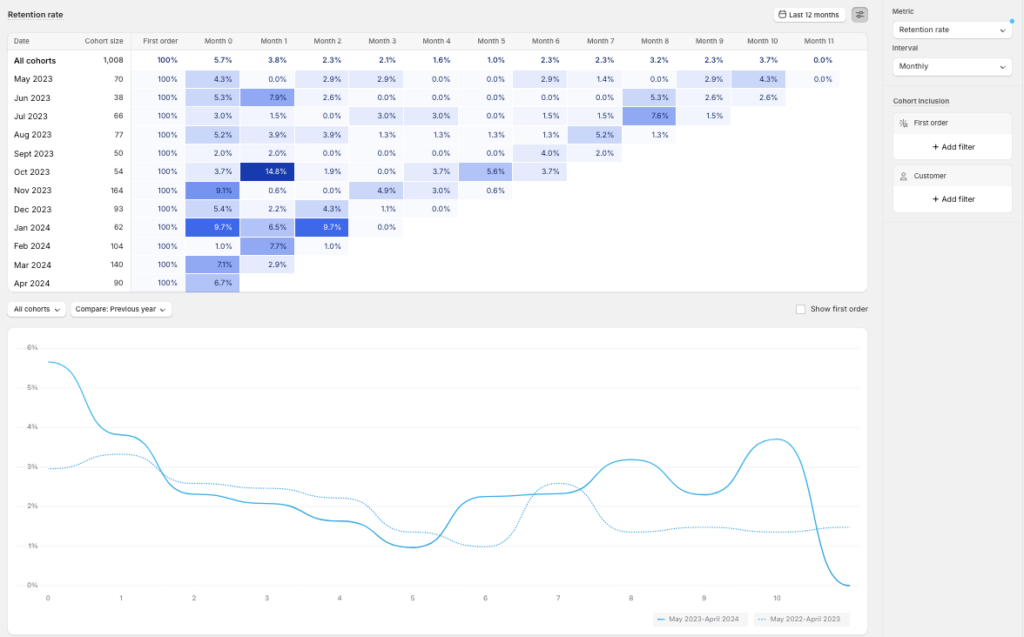
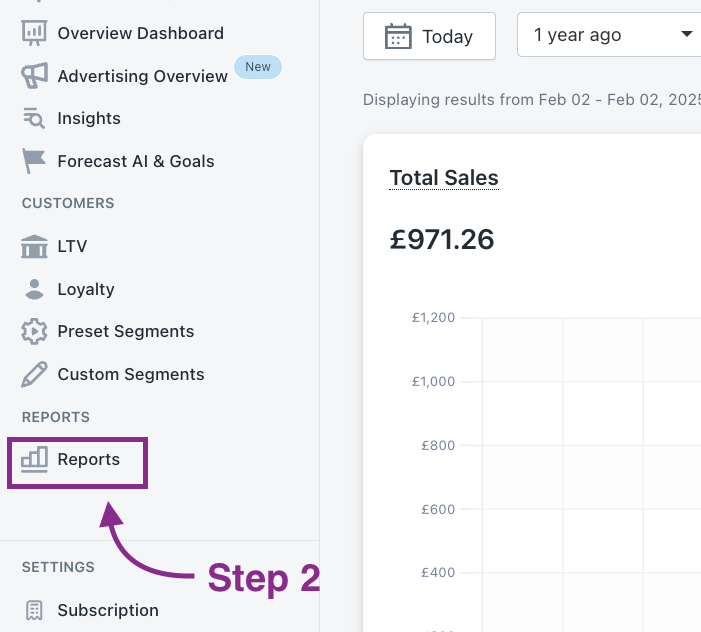
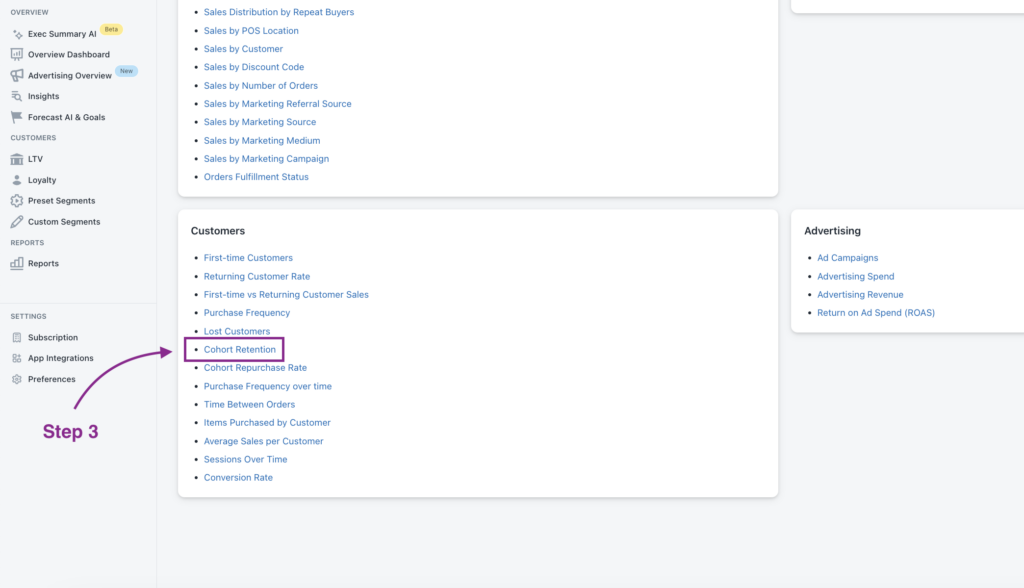
 Above you can see what the cohort analysis looks like. You can see that each group is grouped by the month they first bought from your store. 

Here are 3 ways you can analyze this report to optimize your store. 

Look How Often Your Customers Repurchase 

One of the best things about this analysis that you can see how often your customers come back after their first purchase with you. It’s important to see how many of these customers are actually coming back to your store. These will be the customers that make your business thrive.

If you see the retention is low, it’s important to understand what was happening during that month for your store. 

Maybe you had a shipping issue? You can check out the Sales by Shipping Destination report to explore this

Maybe there’s a purchasing issue? Check out the Returning Customer Rate report. One reason for a low return rate can be customers not enjoying the checkout process. It just takes too long. You’d be able to see this from the amount of first time customers you’re getting. If you’re seeing it drop, that could be an indication.

You can solve this by looking at ways to shorten your checkout process. 

Look at your Onboarding Process

Want to hear something interesting?

66% of customers leave a brand if they feel unappreciated (Salesforce)

How are your customers treated when they first purchase from your store? 

Are you sending some type of communication to them when they first purchase? 

Customers need to feel valued. If you purchased an item from a store and got a personalized message, wouldn’t you look at that store more positively? 

Your customers feel the same way. 

Making your customers feel valued creates loyalty like no other. Sure, there may be other stores that sell products like yours, but they aren’t you. 

Your customers simply won’t buy from someone who didn’t make them feel valued in the way you did. 

The onboarding process is an overlooked stage. Make sure your customers know they are appreciated. It can be as simple as a personalized email, or a product recommendation. 

This is another reason why the cohort analysis is so important, it’s an indication of how your customers perceive you and your products.

Find Out Who Are Your Real Loyal Customers

If you’re still reading, I saved the best way to use this report for this part because I know you’re serious about this. This is one of the best ways to use this report. 

Pretend this is your store. Looking at this report, we see that the April 2024 cohort has a strong performance.

Shopify Cohort Analysis

We know this because of two reasons. One is the cohort performance ($45k in sales alone). But what’s the second reason? 

Let me show you. 

If you click segments you’ll be able to see the preset and custom segments that you created. Click on the preset segment titled loyal customers. Why? The cohort retention report’s purpose is to show you who comes back and buys again. The reason why you even care about this in the first place is because this would show who became a Loyal Customer 


Shopify Cohort Analysis

When you click on loyal customers you’ll why the April 2024 Cohort was amazing, it gave us the most loyal customers from that year. This means loyal this cohort is making multiple orders and has purchased within the last couple months. 

This cohort has such a strong performance. What was happening during this time?

During April 2024, this store launched a successful Google campaign that attracted many new customers. Since there was no other customer acquisition campaign that was ongoing during this time, we can conclude that many of the new customers from this cohort came from this campaign.

So if we can study this group of customers (what they’ve been buying, when they buy it), the store can use this data to get more loyal customers.

But how do you do this? How do we isolate these customers to study them?

This is why customer segmentation is important. It saves you so much time and money.

Using an analytics app, you can create a custom segment for this campaign. Here’s how.

  1. Click on the custom segment tab on the right 

      2. Click “Create Segment” on the right 

  1. We then gave this segment a title, and a description and then selected “UTM Campaign (first orders only)” in the first box. This means the customers who made their first order after accessing this campaign would only be included. Since this campaign took place in April, it means we would get our new customers that first ordered in April (or the April 2024 cohort)

After creating that customer segment, we found something interesting

Shopify Cohort Analysis

Almost 35% of the new customers from the April cohort came from this campaign. After looking at customer data, many of these customers were the ones who became loyal customers. It’s important to explore why that campaign worked. This is where you study the aspects of your marketing campaign. 

  • Seasonality?
  • Right targeting? 

The next thing you do is study the performance of this new segment. Since theres a new segment created, we can use this custom segment on other reports.

Studying these cohorts using detailed reports is too important to ignore. You’re throwing money to the fire if you ignore it.

You need to see how this group of customers interacts with your brand. Since this is a pretty important cohort, you want to make sure you’re always communicating with them on every platform. 

The best part of having this custom segment is that you can integrate this segment with multiple platforms. This lets you target these specific customers way more easily with your marketing. 

Shopify Cohort Analysis

Overall, the cohort analysis report will show you who comes back. But what’s more important is to know what to do with that answer once you have it. The answer to that is to study them. The best way to do that is through detailed analysis done correctly.

Logo By the Numbers

By the Numbers

Empower your business with our Shopify Data Driven App

Shopify App Store
★★★★★ 5/5
  • ✔ Know Your Audience Behavior
  • ✔ Deep Customer Segmentation
  • ✔ Retarget With Integrations
  • ✔ All The KPIs & Reports You Need

How to Access Cohort Retention Report on By the Numbers

Step 1: Install the By the Numbers App​

Download Page Shopify

Step 2: Access the By the Numbers Dashboard and Navigate to the Reports Section

Step 2

STEP 3: Select the Cohort Retention Report

Cohort Retention Report Location
Logo By the Numbers

By the Numbers

Empower your business with our Shopify Data Driven App

Shopify App Store
★★★★★ 5/5
  • ✔ Know Your Audience Behavior
  • ✔ Deep Customer Segmentation
  • ✔ Retarget With Integrations
  • ✔ All The KPIs & Reports You Need

Leave a Comment

Your email address will not be published. Required fields are marked *