Advanced Shopify Customer Reporting
Detailed Reports: Unlock Insights on Customers & Why You Lost Them
Understand Every Customer's Journey
Use advanced Shopify customer reports to understand all your customers.
Whether its your first-time customers, or returning customer, you can use these reports to see the breakdown of everyone.
Which customers actually generate your sales? Why do your customers love THAT specific product?
By the Numbers lets you to see not just the transactions, but the stories behind them.
See what drives your customers to come back, how often they purchase, and what items that capture their interest with reports that break down each customer segment.
With these extremely detailed reports, you create more personalized experiences that increase your brand loyalty and customer lifetime value
Advanced Shopify Customer Reports for Each Stage of the Customer Lifecycle
With By the Numbers, you can pin exactly where you’re losing customers and find opportunities to improve retention with advanced segmenting cohort analysis.
Use retention and repurchase rates to understand how your business retains value over time.
Uncover patterns in purchase frequency and latency.
You can understand your customer from more angles than you want.
Easily Predict When Your Customers will Return and What Will Make Them Purchase
With the best e-commerce reports, you discover the customer trends no other stores know about
There are about 2.1 million daily customers on Shopify.
Many stores get sales. But many stores can’t get those customers to become regular customers.
And they can’t figure out why.
It’s because they don’t have the proper data that helps them see the insights FAST and lets them implement changes EVEN FASTER
How to Use your Customer Data the Right Way
Want to know something that can help you?
- 675 million people bought from a Shopify store in 2023
- Since 2020, the number of orders placed with Shopify store owners have increased 47.7%
Why am I telling you this?
Because it means e-commerce is still growing and will continue to grow. But it also means people are getting smarter with their stores.
They’ve realized the true way to grow their store is when they understand their customers. It makes sense right? They are the people that buy from your store after all.
But too many Shopify stores don’t realize how important it is to understand their customers at an analytical level. This is why they fail.
The best Shopify reports grow your store easily and quickly.
You can use these reports to make valuable insights:
- Upsell opportunities
- Use our average sale per customer report to see which customers really drive your sales. This is the perfect group to upsell to. They already love your products, so continue offering them more things they’ll love.
- Customer Acquisition
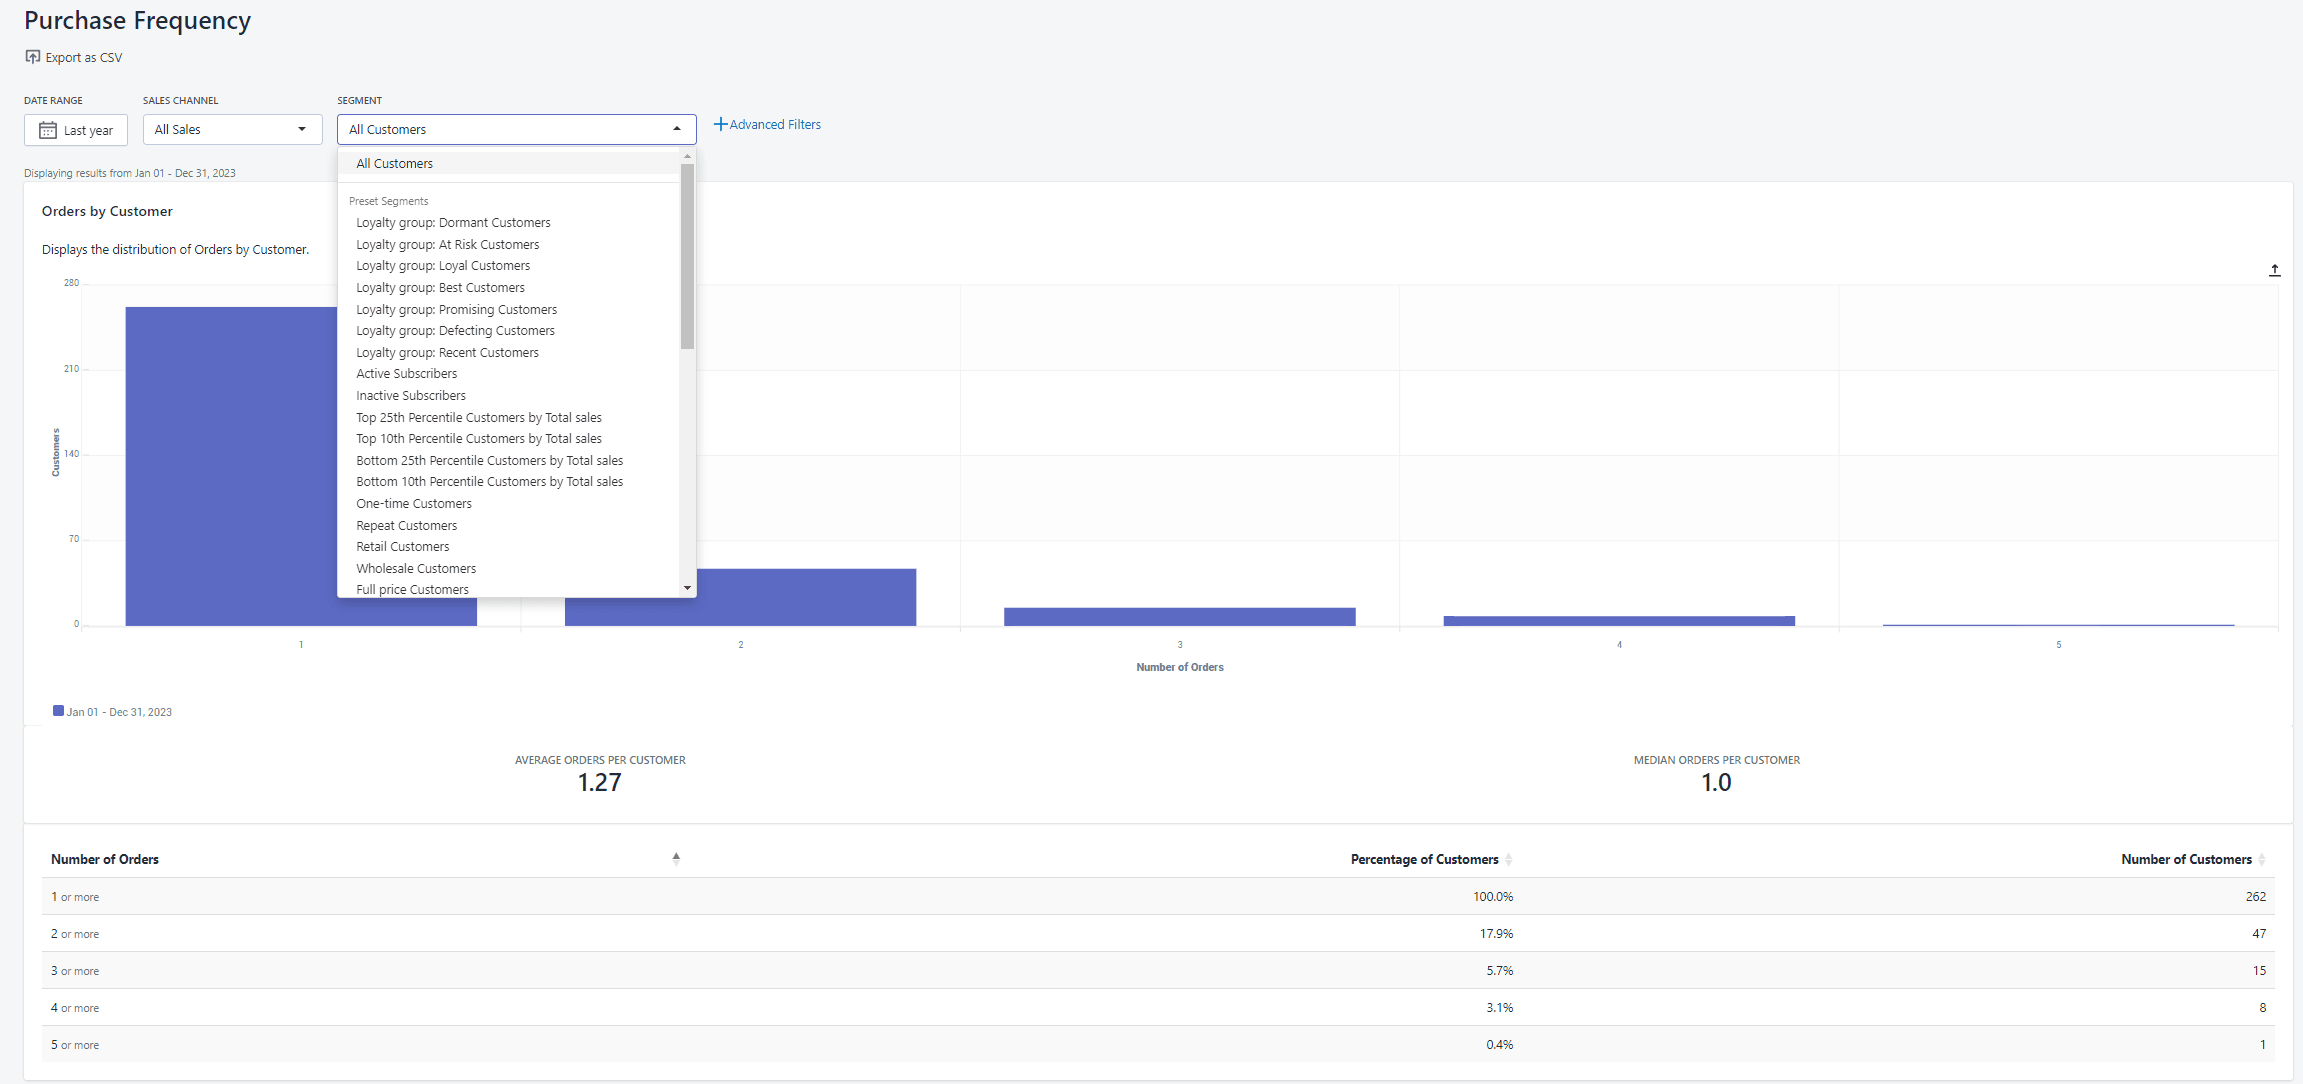
- You can access the purchase frequency report to see when your loyal customers buy the most during the year. Why? If you found what made them tick during this time, you can use it find a way to target your promising customers. This lets you convert these customers into loyal ones.
- Product Optimization
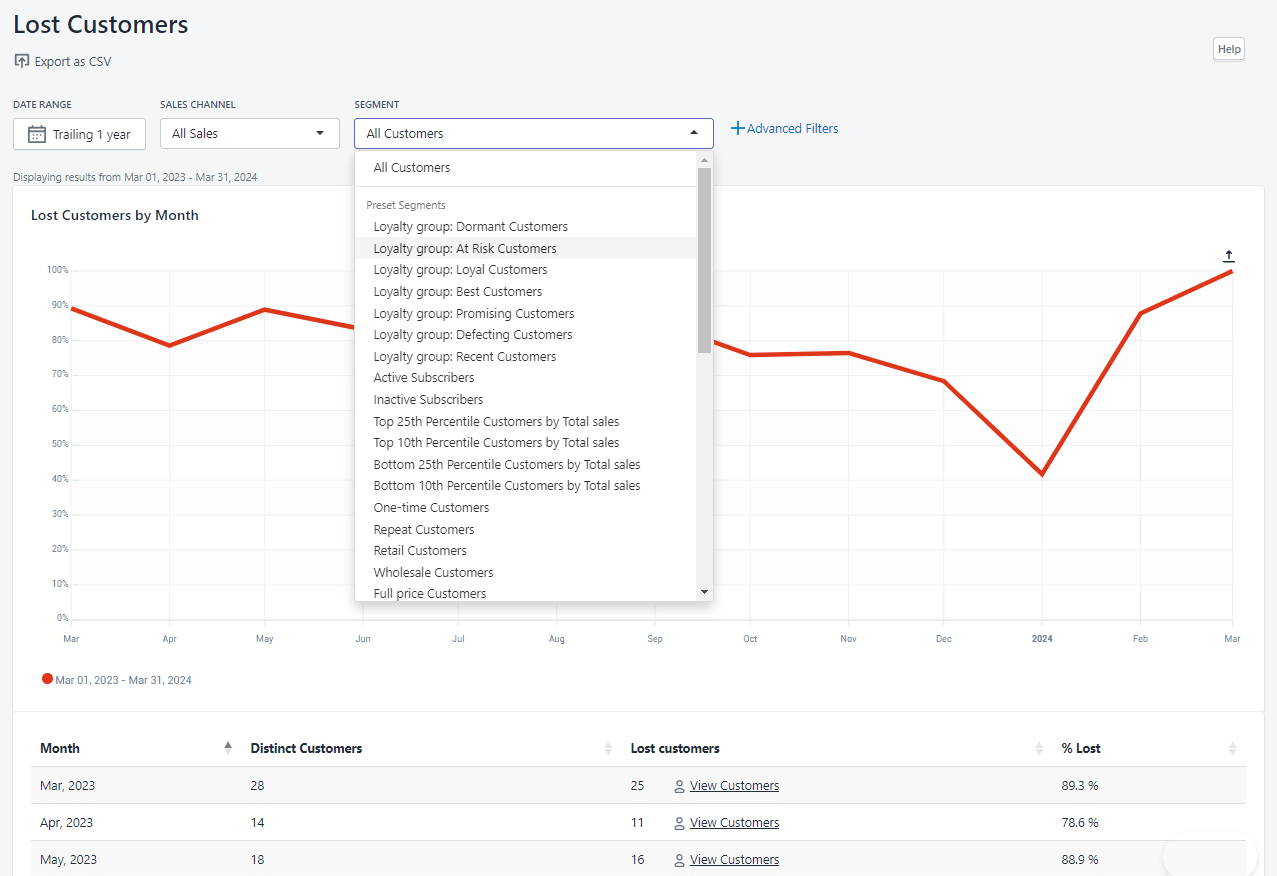
- Use the Lost Customers report to see which items are common amongst your at risk customers. Did they buy something within the last 6 months that caused them to be at risk? Should you fix the product they bought or just eliminate it altogether?
- Customer Retention (Done Without the Headaches)
- Use the First time vs Returning customer sales to see how many unique customers you have. If your returning customers are low, look at the channel you’re getting these returning customers from. Look at investing in this channel more.
Why You Shouldn’t Just Use Shopify
Shopify provides analytics that are perfect for a small store. But if you’re on this page, we’re assuming you’re not trying to be or stay as a small store.
You want to get bigger. To do that you need the right analytics app.
If you do this on your own, you’re looking at hours spent collecting data, then taking that data and trying to find a way to analyze it to understand your customers.
When we say hours, we mean thousands of hours. Also over $100 000 likely to be spent if you really want to get a good analysis that will really give you the data you need.
You also then need to figure out how to use this data and make a decision that will grow the business.
1000 hours and $100 000 of data analysis can be reduced to 1 hour and $1200 (or less depending which plan you choose). You not only get an analysis that’s accurate and applicable to your business. You can spend more time doing what you actually want to do.
Above is one of our most loved reports: The Average Sales Per Customer Report. You see how much each customer generates you, you can get specific with the time frame, the the segment and even the sales channel.
Let’s take an example.
Let’s say you wanted to see how your customers acquired from your Google Ads Campaign 4 months ago are doing. You first adjust the date to only be from the last four months. Then adjust the sales channel to your Google Ads campaign, then group by whatever time frame you want (month, week, etc.)
An analysis like this would’ve costed countless hours and money.
You just got it within 10 seconds and it barely costed you anything.
Client Testimonials
Get a free demo by a Shopify data expert and see what all the fuss is about!
READY TO TAKE YOUR BUSINESS TO THE NEXT LEVEL?
Or get started with a Start A Free Trial