How to See First-time and Returning Customers on Shopify
Learn How to Identify Your First-time and Returning Customers
This article we’ll guide you in identifying your First-time and Returning Customers on Shopify in both By the Numbers and Shopify. Understanding who your repeat customers are can significantly enhance customer retention strategies, boost revenue, and improve overall business sustainability. Then we’ll guide you through the process of tracking repeat buyers on By the Numbers, Further enhancing your understanding by using it’s segmentation features!
Step-by-Step Guide on Identifying First-time and Returning Customers on Shopify
Shopify provides basic tools for tracking repeat customers, by displaying the Returning Customer Rate under the Analytics section. This simple metric can help identify loyal customers, which is essential for targeted marketing and customer retention strategies.
Step 1: Log into Your Shopify Dashboard:
Start by logging into your Shopify account to access your store’s data
Step 2: Navigate to Reports:
From the Left navigation menu, click “Reports”, which is found under “Analytics.
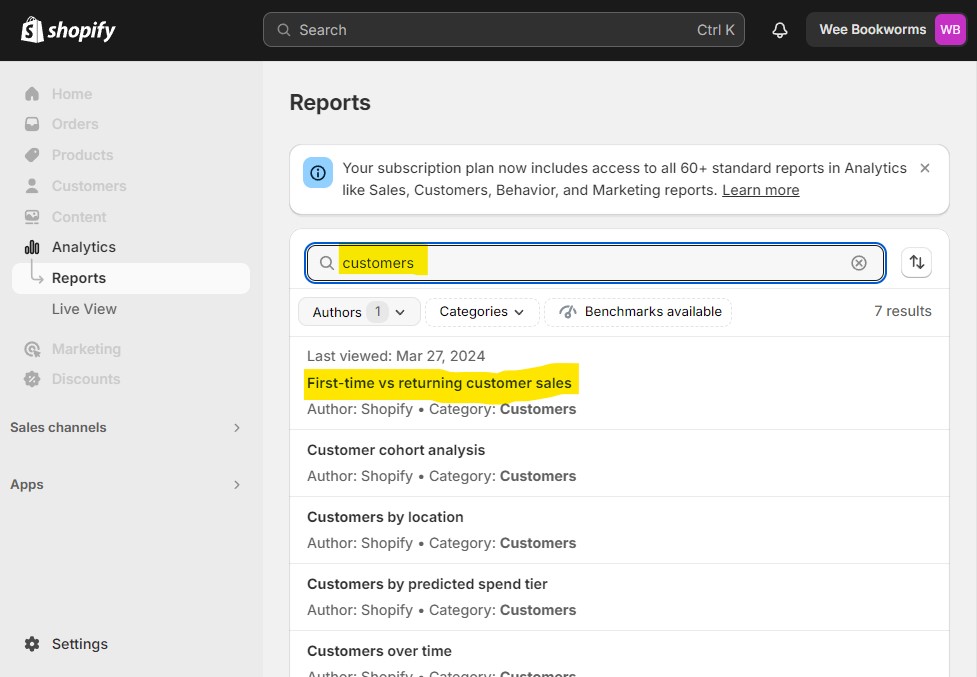
Step 3: Find the "First-time vs returning customers sales" Report:
Type “customers” into the search bar to help find the “First-time vs returning customer sales” report, and click it.
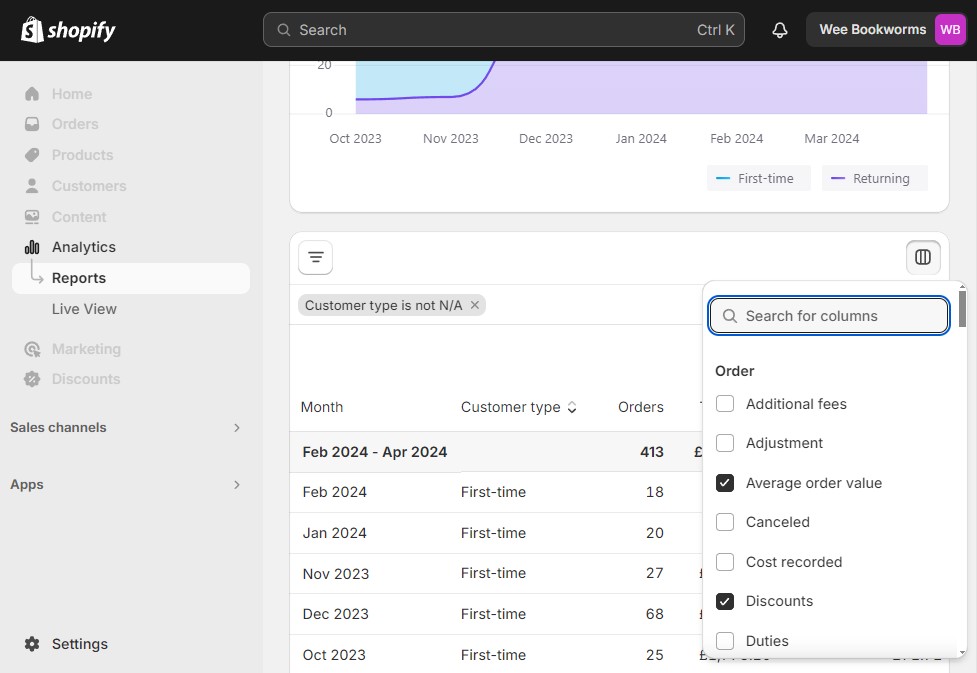
Step 4: Customize the Fields:
Scroll down to the spreadsheet and click on the “Fields” icon that is located on the top right side of the report. Then from the drop down you can customize all of your fields. Start by selecting Average order Value, Gross Sales, Discounts, Tax and Returns. Note Purchase Frequency is not available for that we will later use By the Numbers (BtN).
Step 5: Unlocking Advanced Insights with By the Numbers
Discussion on the limitations of Shopify’s native analytics for depth and actionable insights regarding repeat buyers.
Introduction to By the Numbers and its capabilities for deeper customer segmentation and analysis.
How to view your First-time and Returning Customers (Shopify) in By the Numbers
Step 1: Install the By the Numbers App
Start by installing the By the Numbers app from the Shopify App Store. This app provides complete analytics and reporting features to track and analyze your store’s marketing and sales data.
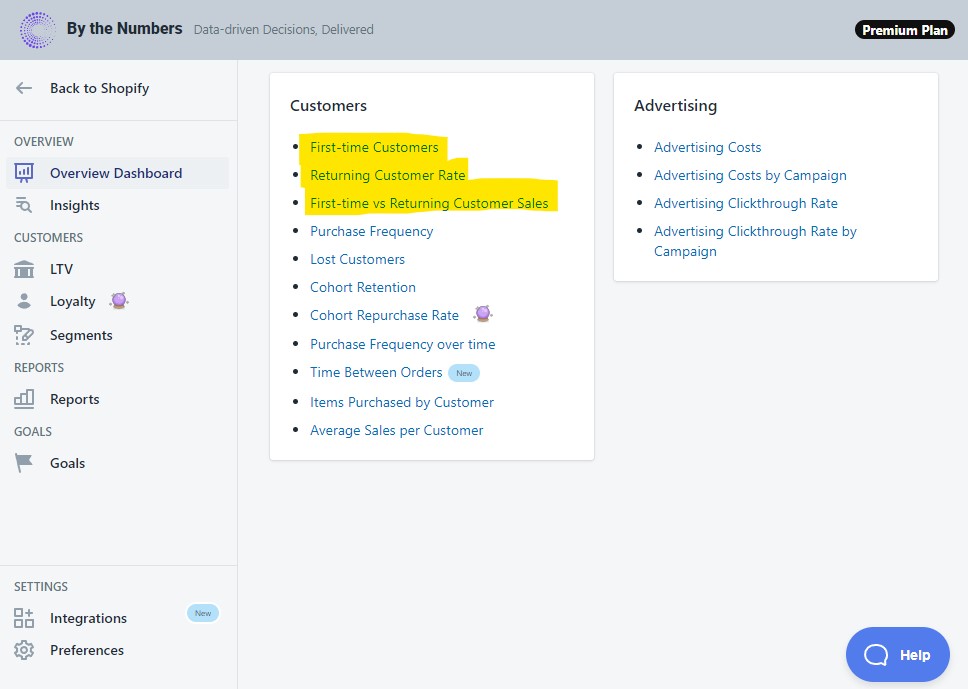
Step 2: Access the By the Numbers Dashboard and Navigate to the First-time vs Returning Customer Sales Report
After installing the app, enter By the Numbers from your Shopify dashboard (not separate account is needed). Now select Reports from the left Navigation menu. Scroll down to the ‘Customers’ section. This section allows you to wide variety of reports related to your customers, like the First-time vs Returning Customer Sales report, which has all the information you need. For more focused and simplified reports you can also use the First-time Customers report or the Returning Customer Rate Report.
Step 3: Choose the "First-time vs Returning Customer" report
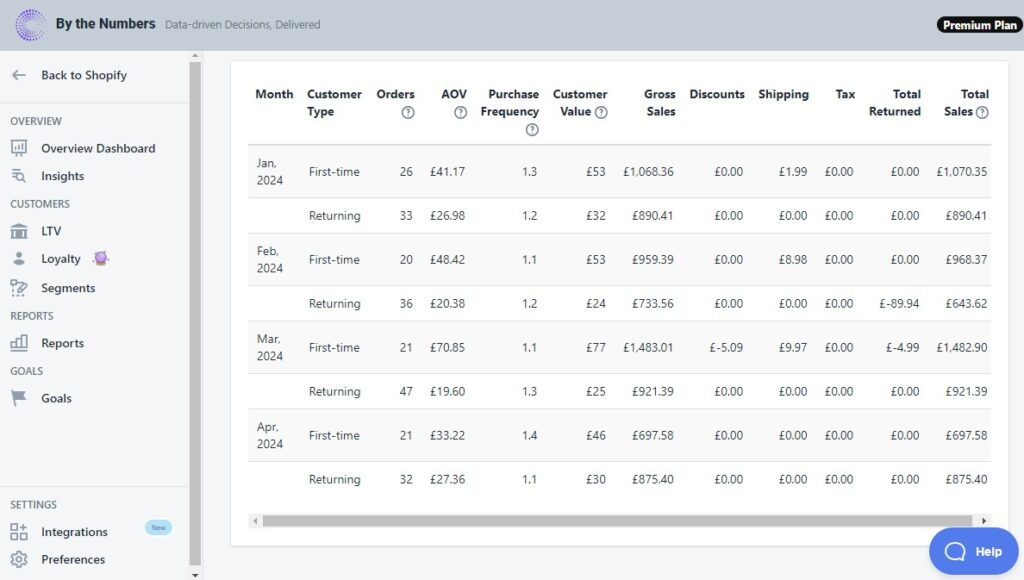
In the Customers section, locate and select the your report of choice. In this example we will look at the “First-time vs Returning Customer Sales” report. This report specifically focuses on calculating and presenting sales data attributed to First-time and Returning Customers and includes orders, AOV, purchase frequency as well ass all your sales data like discounts, shipping, tax and total returns.
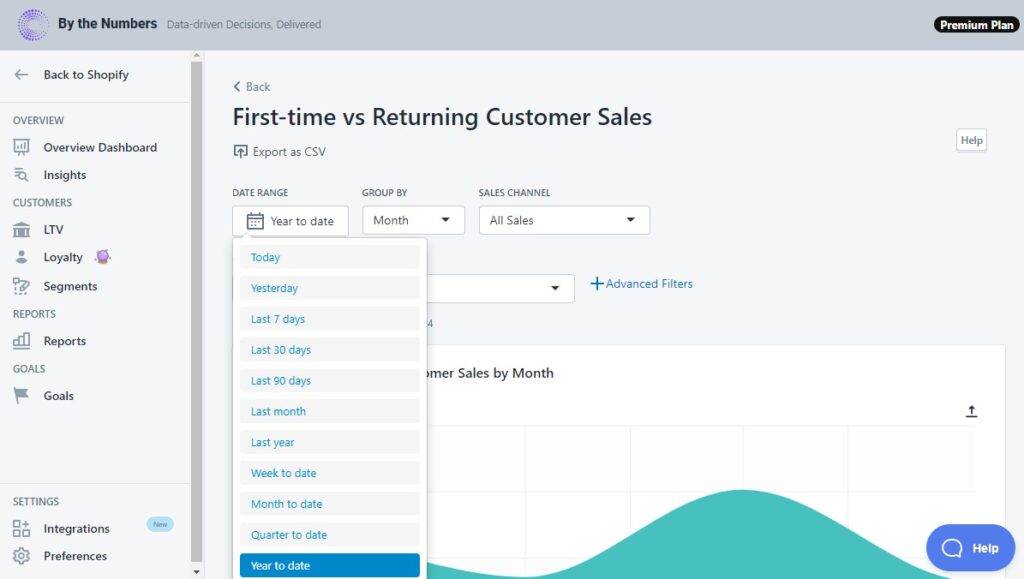
Step 4: View and Optimize your First-time vs Returning Cusomer Sales Data
After selecting the “First-time vs Returning Customer Sales” report, your last step is to simply decide on your analysis time window and the Period you wish to Group by. Click “Date Range” to select from a range of time frames like “Month to date”, “Last Year” or set a custom range using the calendar date picker. Select “Group by” to decide on your Period Grouping like Day, Week, Month, Quarter or Year. You can now view and download your data in CSV format
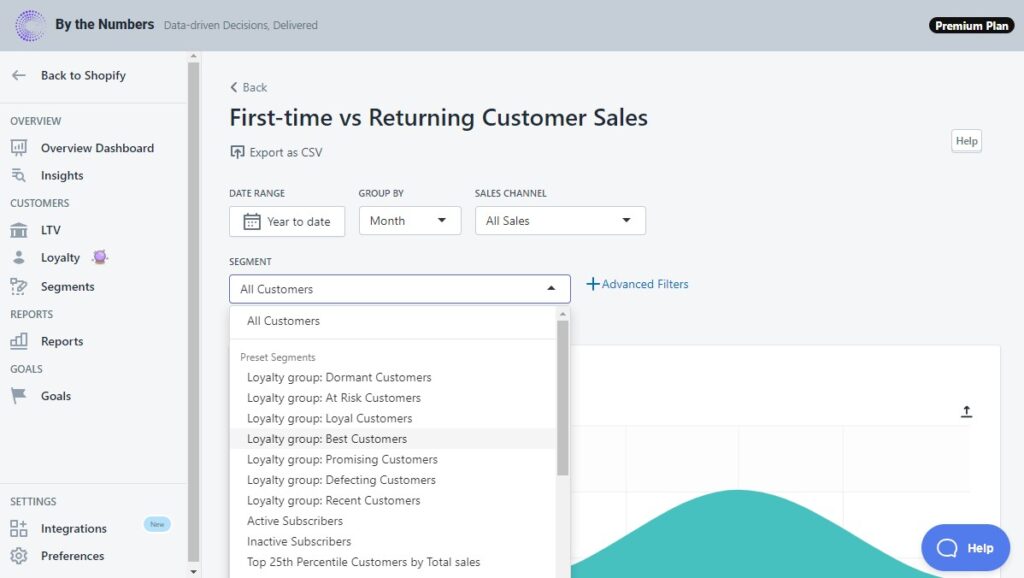
FEATURE HIGHLIGHT: Custom Segmentation of Orders Over Time
By the Numbers offers a premium feature, filtering by segment. Pick one of the pre-made segment groups that the app offers such as your customer’s loyalty (Best Customers, At Risk Customers, Dormant Customers) or choose who to address by segmenting according to their behavior (Active Subscribers, Top 25th Percentile Customers by Total sales…). If none of those fit your needs, create your own advanced segment filters and dive deep into your data.
READY TO TAKE YOUR BUSINESS TO THE NEXT LEVEL?
Get a free demo by a Shopify data expert and see what all the fuss is about!
Or get started with a Start A Free Trial


