Want to know how to add Google analytics to Shopify? Before we show you, here’s how easy it was to add Universal Analytics to Shopify:
- Get the Tracking ID for the UA
- Put it in Shopify
- Online Store > Preferences
- Enter your ID and save changes
That’s it.
But with Google Analytics 4 (GA4) being the new platform on the block, this is how you add it to Shopify:
- Install Google Sales Channel
- Shopify Admin > Sales Channel > Add Sales Channel > Google > Add Channel
- Connect your Google Account
- Access your Google Sales Channel
- Go to Settings and click the Google Analytics setup
- Get your GA4 ID
- Enter it into the Sales Channel
- Save changes
As you can see, way more steps and there’s a problem
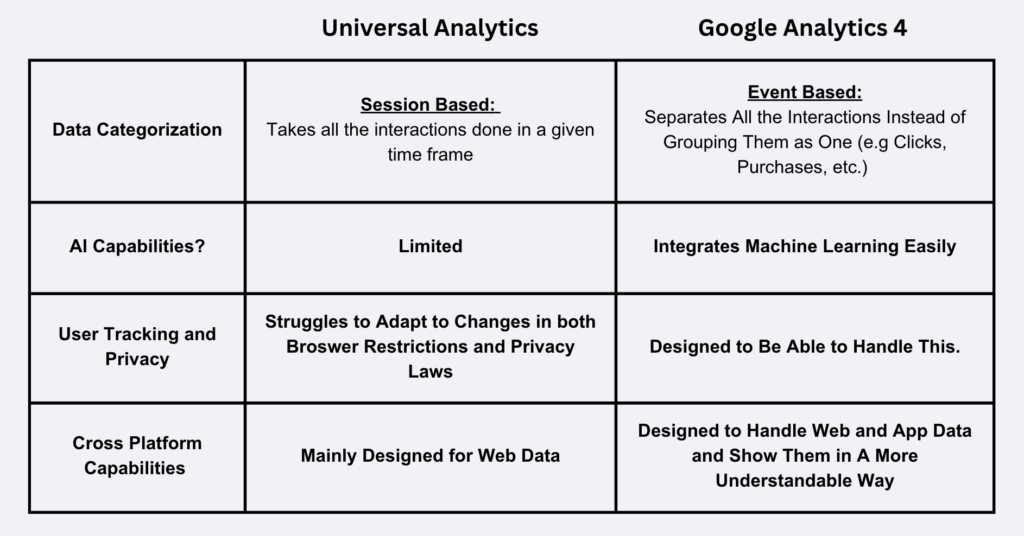
We’ll address it after we show you what the difference is between UA and GA4

The Problem with GA4
From the above table, it doesn’t seem that there is a problem.
It actually seems that GA4 is a good upgrade. Sadly, many disagree. Do you remember the first feature that was covered above (data categorization)? Like it was stated, GA4 is event based instead of session based.
That brought a huge problem
UA was session based which meant everything was grouped nicely. It was something everyone was used to.
An analytics dashboard needs to be designed in a way that makes reading data easy.
But many users think GA4 did everything opposite of that.
First off, the dashboard is too confusing to understand. It required users to relearn everything. Imagine if you had an iPhone, but then were given another phone from another galaxy that you’re now forced to use.
You have to learn how to use this phone but you don’t even know how it works. That’s basically what happened with GA4. It’s an analytics platform that makes you have to do more work so you can see what UA could’ve shown you immediately.
Here’s the problem:
- Event-Based Data Changes Too Much:
- Using Event Based data means you have to create custom metrics for way too many things
- If you wanted to see how many reached your thank you page, UA shows you that in seconds because it’s session based.
- With GA4 you have to create custom events that need you to code (unlike on UA) and mark certain events so you can get this data. It requires to set parameters and event conversions that UA would’ve done for you.
- Limited Reports:
- Simply put, UA had many detailed reports. GA4 took away many of these reports and now only have the standard reports. You once again have to do more work just to see results that UA had provided to you already
- Data Retention is Limited:
- This is for user-level data. GA4 only lets you store this data for up to 14 months. After that it’s deleted. UA had a longer time period. GA4 requires you to have an external storage if you want to store longer than 14 months which means higher costs are incurred
- Relearning Everything:
- All the terms have been changed in GA4. If you’re a user of UA, it means you have to relearn all the jargon to understand what GA4 is trying to tell you. It’s time-consuming and shouldn’t need to occur

By the Numbers
Empower your business with our Shopify Data Driven App

- ✔ Know Your Audience Behavior
- ✔ Deep Customer Segmentation
- ✔ Retarget With Integrations
- ✔ All The KPIs & Reports You Need
The Solution
The first is Plausible
If you want a super easy to understand interface, Plausible is a great platform.
It complies with all data privacy laws and what’s even better is that it’s open source. You can see what the developers are up to and help make the product even better.
One problem when it comes to websites are the site speed. Sometimes with analytics tools, the site becomes slower. With plausible, you get a lightweight tool (less than 1kb). This keeps your site fast, while giving you the data you actually need even faster.
It’s designed to give you all the data you want to see for your site such as visits, pageview, bounce rate, and visit duration immediately.
There’s no jargon you need to learn in order to understand your data. Best of all, it was designed to help those who hated GA4.
However, let’s say you own a Shopify store, there’s a better solution to your issue. In order to find the solution, lets properly define your problem:
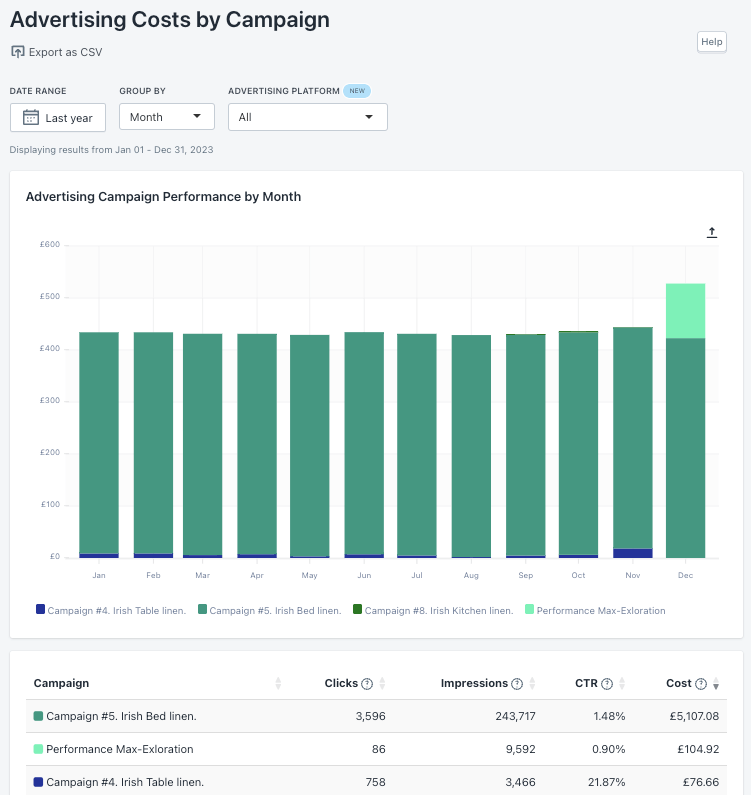
You want to know how your Google Ads are doing because you want to see if they are generating traffic to your store. You also want to see that that traffic is converting to sales.
By the Numbers provides easy to read reports that allow you to customize your data any way you want it.
Once you add your data from Google onto By the Numbers, you uncover insights in a fraction of the time it takes to do on your own, and costs much less as well.
With an easy to use dashboard, you not only can access reports on how your ads are doing, you can see how each segment of your audience are doing as well.
Were you trying to target a certain segment of your customers? Are you trying to see how your long-time customers are reacting to your ads?
By the Numbers provides the data you need to see the insights you can actually use.

Look at data from any date range you desire from any campaign you desire, and from any segment.
Organize your segments the way you want to (you can even create custom filters which provide endless options)
Once you start to explore your advertising data, it’s common to start to wonder what other answers you can find for your audience in terms of sales, product, or even the customers themselves.
By the Numbers can answer those questions for you too.

By the Numbers
Empower your business with our Shopify Data Driven App

- ✔ Know Your Audience Behavior
- ✔ Deep Customer Segmentation
- ✔ Retarget With Integrations
- ✔ All The KPIs & Reports You Need


