
How do You Calculate the Number of Customers You Lose on Shopify?
Shopify doesn’t have the power to let you calculate the number of lost customers. Unlike a Lost Customers report, which By the Numbers (BtN) offers, it offers some retention-related reports. This article will guide you in knowing how many lost customers your store had in a given month using BtN.
How to Access the Lost Customers Report on By the Numbers
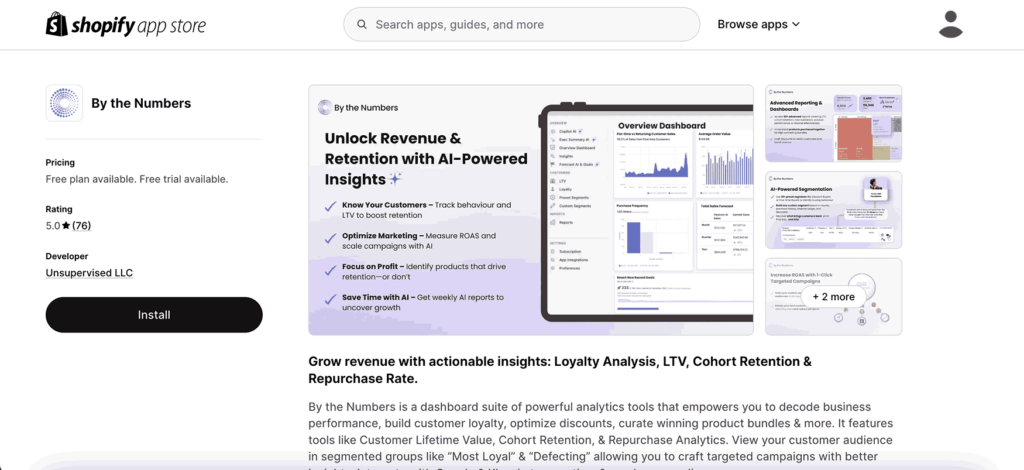
Step 1: Install the By the Numbers App
By the Numbers, available in the Shopify App Store, provides insightful data about your store, your customers, and their purchasing habits, empowering you with the knowledge to make informed decisions.
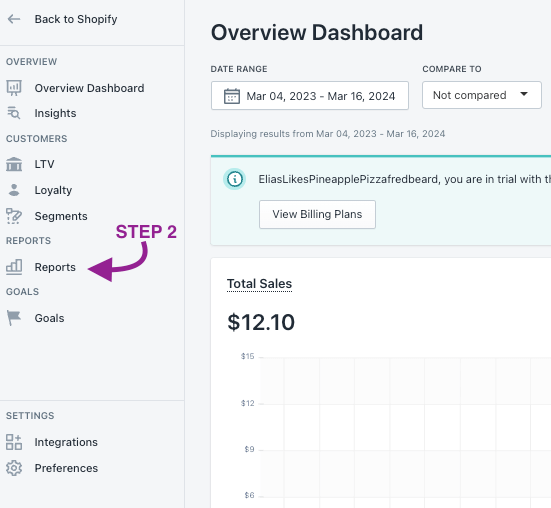
Step 2: Access the By the Numbers Dashboard and Navigate to the Reports Section
Accessing the By the Numbers Dashboard and Navigating to the Reports Section is a breeze, empowering you to take control of your customer retention strategy.
Locate the Reports section on the left-hand menu of your screen.
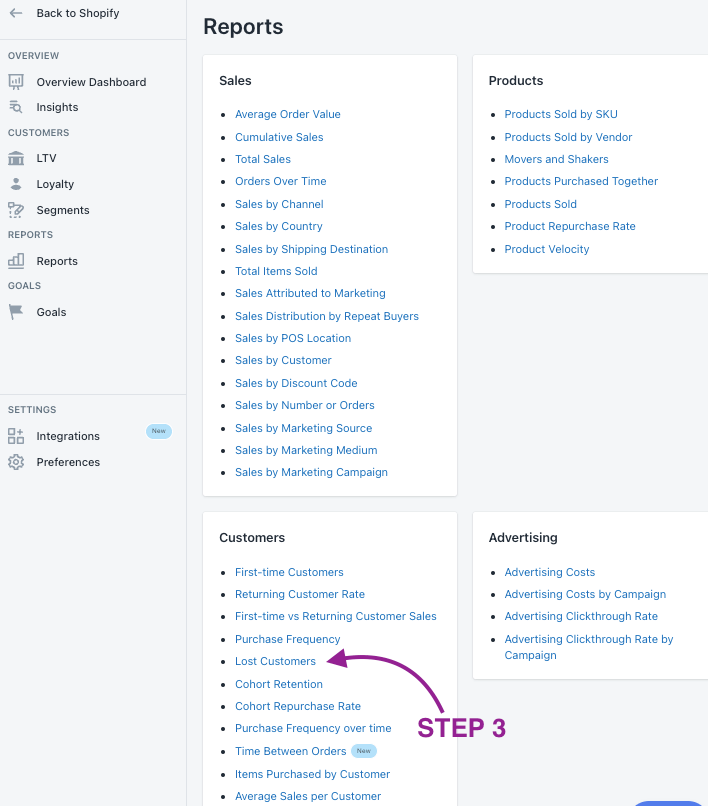
STEP 3: Select the Lost Customers Report
The Customer section is a key part of By the Numbers. It’s located at the bottom of your screen. There, you’ll find the Lost Customers Report and other reports and tools that can help you understand your customers and improve your store’s performance.
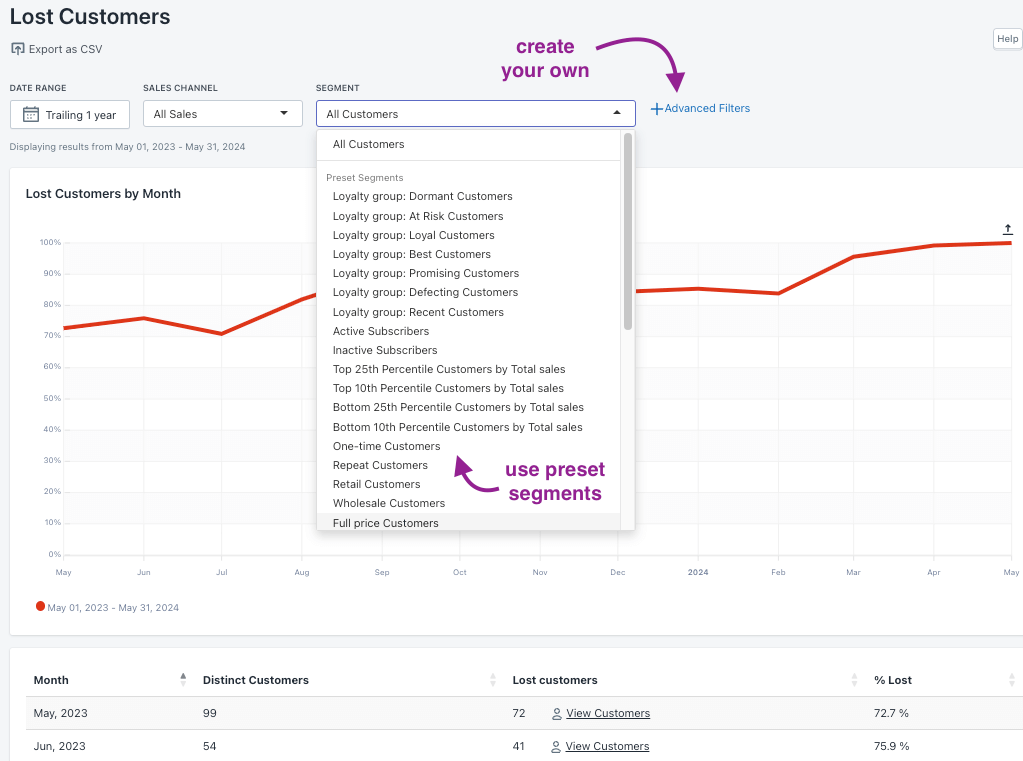
This is a screenshot of By the Numbers’ Lost Customers Report:
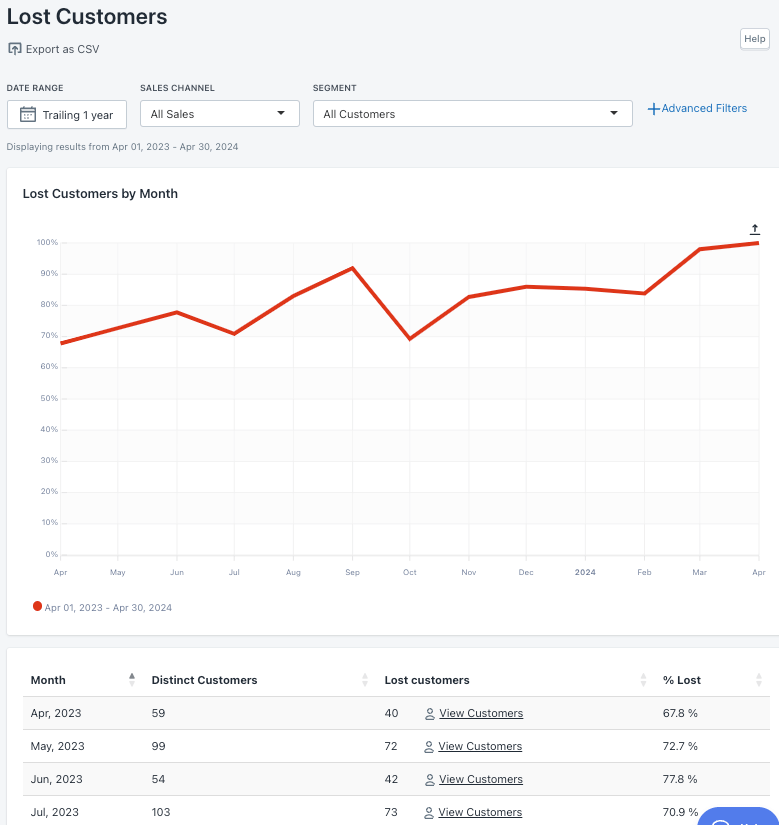
The data it provides includes:
Month: The month to extract data.
Distinct Customers: Different customers of your store that month.
Lost Customers: Number of customers who placed their last order and have yet to return according to that month.
%Lost: Percentage of customers lost that month.
The Lost Customers Report is a powerful tool for understanding customer retention. It tracks customers who have purchased but have yet to return. It includes orders made through every different channel. A low number of lost customers indicates a high rate of returning to your store, which is a strategic advantage for your business.Please note that in the current month, the chart may show up to 100% because customers haven’t had enough time to make a return purchase. This report does not specify a time frame for when the “next” order should occur.
Let’s clarify this with an example:
Imagine you have 3 Customers (A, B and C) and the following log of Orders over a period of time:
January 2024
- Customer_A places at least one order.
- Customer_B places at least one order.
- Customer_C places at least one order.
February 2024
- Customer_A places at least one order.
March 2024
- Customer_A places at least one order.
- Customer_B places at least one order.
April 2024
- Customer_A places at least one order.
Given the order log above, if we were to look at the Lost Customers report, we would see:
- Customer_C would be counted as “Lost” in January as they made no purchases after that month.
- Customer_B would be counted as “Lost” in March as they had no purchases after that month.
Also:
- In January, there were three distinct customers and 1 Lost customer (Customer_C).
- In February, there was one distinct customer and 0 Lost customers (Customer_A orders again in March),
- In March, there were two distinct customers and 1 Lost customer (since Customer_A purchased again in April and Customer_B never returned).
- In April, there was 1 distinct customer and 1 Lost customer (since, in this example, April is the ‘end of time’ and we have no record of Customer_A purchasing again). This is why the graph always ends up to the right. The ‘end of time’ refers to the last month for which you have data. In this case, it’s April because that’s the last month in our example’s order log).
This report and the Customer Cohort Retention report can help you gain deeper insights into customer retention. The Customer Cohort Retention report shows the percentage of customers who continue to make purchases over time, allowing you to track the effectiveness of your customer retention strategies.
Benefits of using By the Numbers to access your Lost Customers Report.
In addition to the regular filtering capabilities by date, range, sales channel, and segment, By the Numbers has two more important features.
With the powerful Custom Segmentation feature, you can explore specific groups of your audience, adapt your reports to them, and, most importantly, communicate with those lost customers through a win-back campaign. The possibilities are endless!
This is where By the Numbers app integrations come into play. Imagine retargeting those segmented audiences through Klaviyo, Google Ads, TikTok Ads, and Meta and integrating their data into your BtN reports. Identify all those at risk of churning and re-engage them!
Custom Segmentation
By the Numbers allows you to use the preset segments or create your own:
Accessing preset segments or creating custom ones is a straightforward process:
1- Log into By the Numbers and find the segments section in the left-hand menu. Once you click on segments, you’ll find two tabs: Preset Segments and Custom Segments.
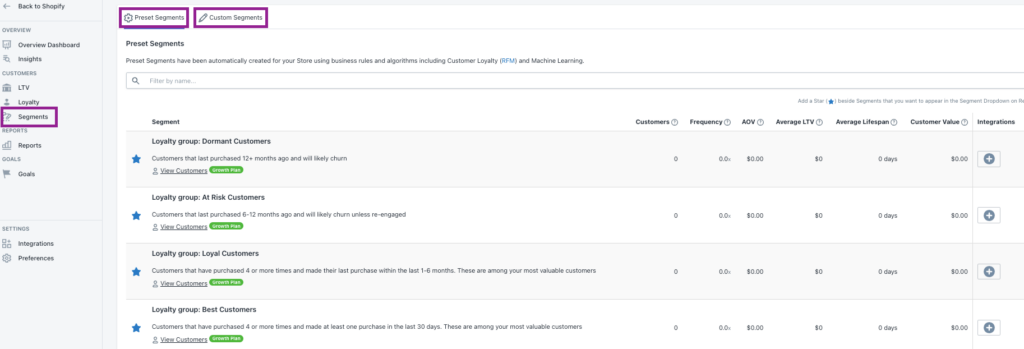
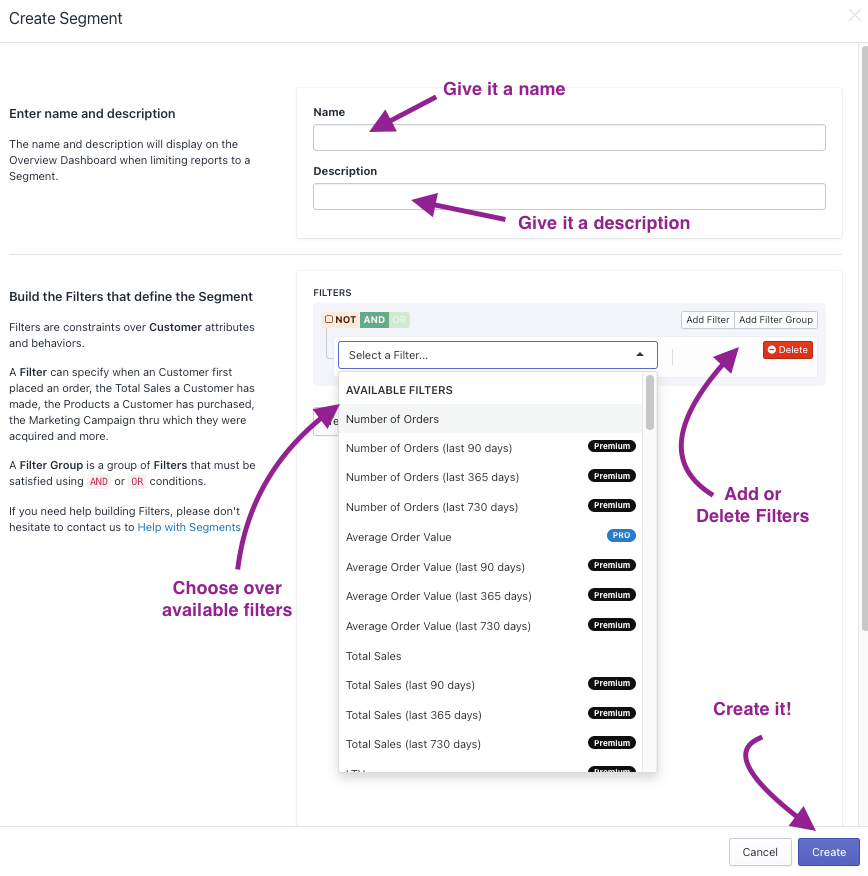
2- At the top right corner, you’ll see a button that says ‘Create Segment’. Click on it to see a window pop up. You can select the filters and create your segments there. For example, you could create a segment for customers who haven’t made a purchase in the last three months or a segment for customers who have spent over $100 in your store.
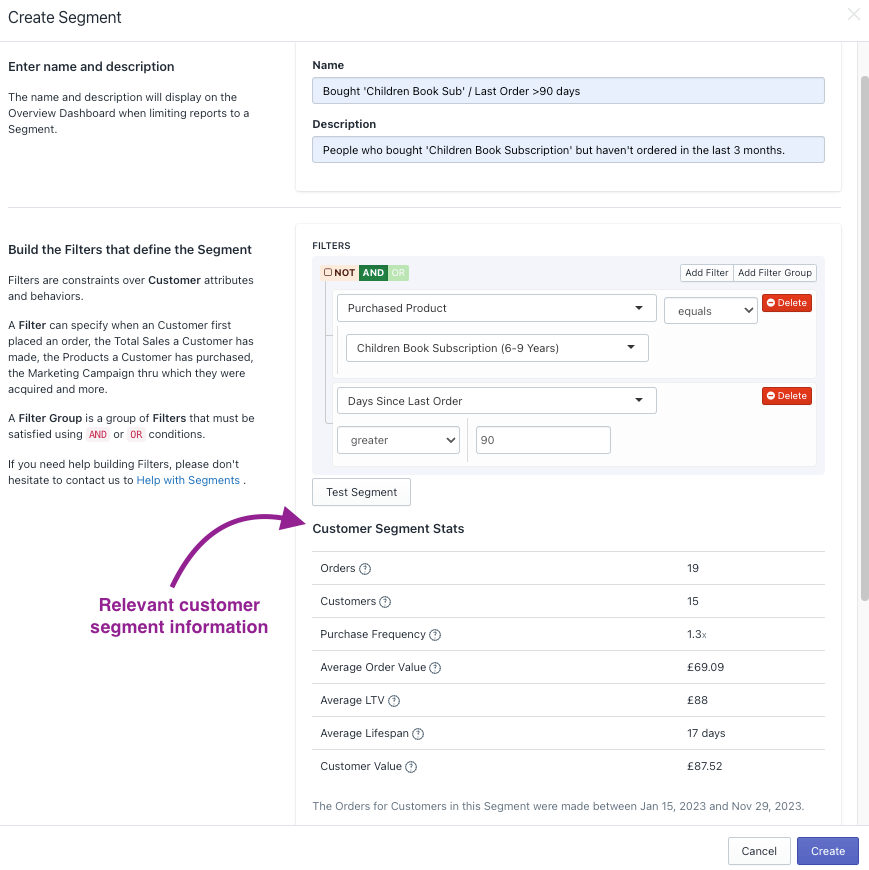
The last thing to do is ‘test your segment.’ This will help you see if you have created it correctly and if it is functional. It will also supply you with relevant customer segment data, as shown in the following screenshot.
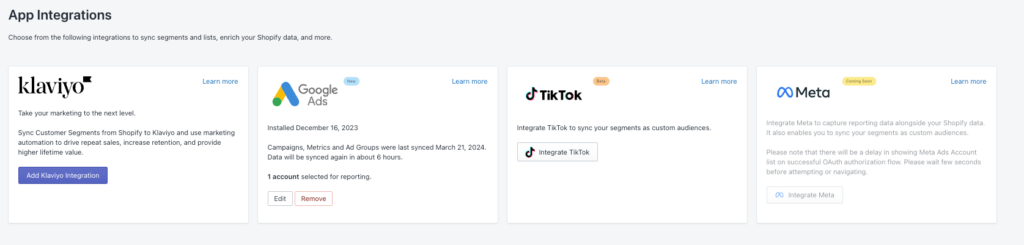
By the Numbers App Integrations
BtN integrates seamlessly with Klaviyo, Google Ads, TikTok Ads, and Meta. This means you can use the data from these platforms in your BtN reports and retarget customers through one of those channels. For example, you could set up a campaign to win back all those lost customers you learned about through BtN’s Lost Customers report. This integration allows you to leverage the data from these platforms to create more targeted and effective retargeting campaigns.
To set it up:
1- Once logged into By the Numbers, find Integrations on the left-hand menu in the settings section.
2- Choose the integration you want to add and follow the directions. It’s a matter of a few clicks.
Integrating BtN with these platforms is straightforward and won’t take more than a few clicks. It’s an excellent opportunity to find all those segments you are interested in, retarget them through Klaviyo, Google Ads, TikTok and Meta and incorporate the data into your reports. For example, you could find out how much ad spend you need to bring back one of those lost customers. Or, you could create a segment of customers who have purchased in the last 6 months but haven’t purchased in the previous 3 months and retarget them with a special offer.
Get a free demo by a Shopify data expert and see what all the fuss is about!
READY TO TAKE YOUR BUSINESS TO THE NEXT LEVEL?
Or get started with a Start A Free Trial
