How do You Find Your Average Sales per Customer on Shopify?
Understanding your Average Sales per Customer (Shopify), the average amount of money each customer spends per transaction, is crucial for any Shopify store owner. While Shopify doesn’t provide this metric by default, you can calculate it manually or use a third-party app. This article will guide you on accessing the Average Sales per Customer report through the By the Numbers app and calculating it yourself. Let’s dive in!
How to Access the Average Sales per Customer (Shopify) Report
Step 1: Install the By the Numbers App
Getting started with By the Numbers is a breeze. Simply head to the Shopify App Store and install it. This user-friendly tool will increase your confidence in data analysis by empowering you with valuable insights about your store and customers.

Step 2: Access the By the Numbers Dashboard and Navigate to the Reports Section
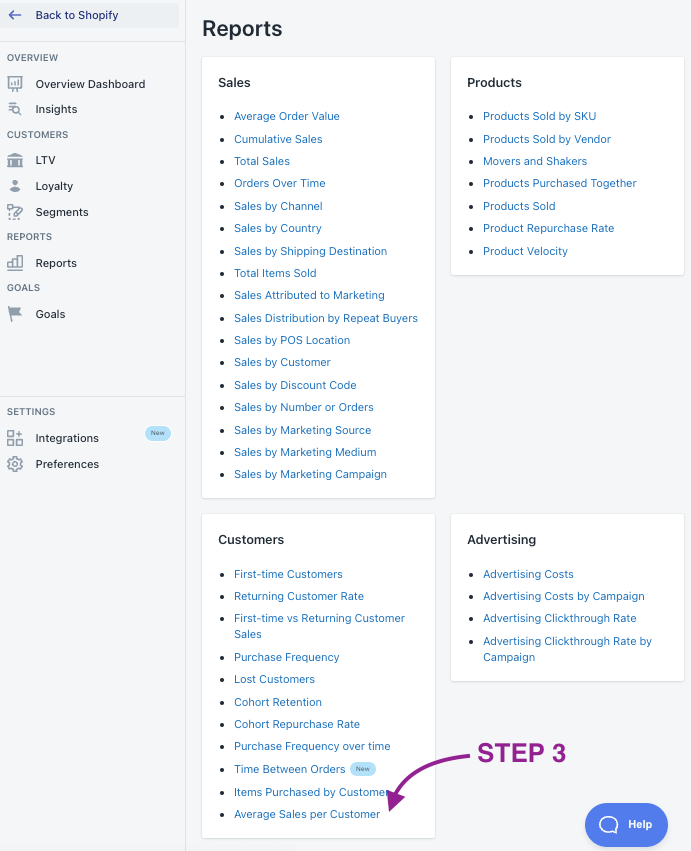
The Reports can be found on the left-hand menu.

STEP 3: Select the Average Sales per Customer Report
The Average Sales per Customer Report is in the customer reports section at the bottom of your screen.
The following screenshot shows what the Average Sales per Customer report looks like:
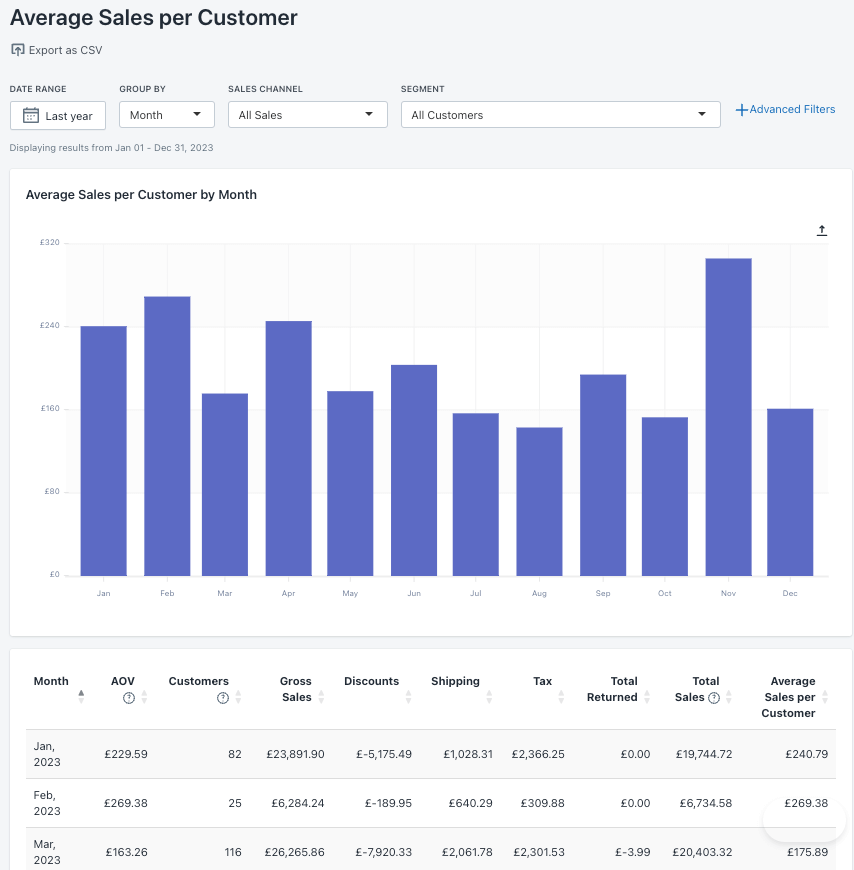
The report provides you with the following data:
Month: The month from which data will be extracted.
AOV (Average Order Value): The Total Sales (not including returns) divided by the number of orders.
Customers: The total number of (distinct) Customers.
Gross Sales: The product price multiplied by the quantity (before taxes, shipping, discounts, and returns)for a collection of sales. This includes all orders that were paid, pending, authorized, partially paid, or partially refunded.
Discounts: The total discounts applied on orders on a given date.
Shipping: The total shipping charges applied to orders on a given date. This excludes shipping discounts.
Tax: The total amount of taxes based on the orders.
Total Returned: The total value of goods returned by a customer.
Total Sales: The total sales — that is, gross sales – discounts – returns + taxes + shipping charges.
Average Sales per Customer: the total sales generated divided by the total number of customers.
This report is beneficial if you want to track your store’s customer acquisition and service delivery performance. By regularly reviewing your Average Sales per Customer, you can identify trends and adjust your pricing, marketing and customer service strategies. Healthy brands usually see this metric increase, meaning clients spend more money in their stores. Understanding and monitoring this metric can ensure your store is on track to meet its sales goals.
You then can also see what your Customers Lifetime Value is
How to Calculate your Average Sales per Customer on Shopify
Calculating your Average Sales per Customer on Shopify manually is straightforward: divide your Total Sales by the Number of Customers in a given period. For example, if your store made $10,000 in sales and had 100 customers in a month, your Average Sales per Customer would be $100. It’s that simple. This basic formula can provide valuable insights into your store’s performance and customer behavior.
Benefits of using By the Numbers to access your Average Sales per Customer Report.
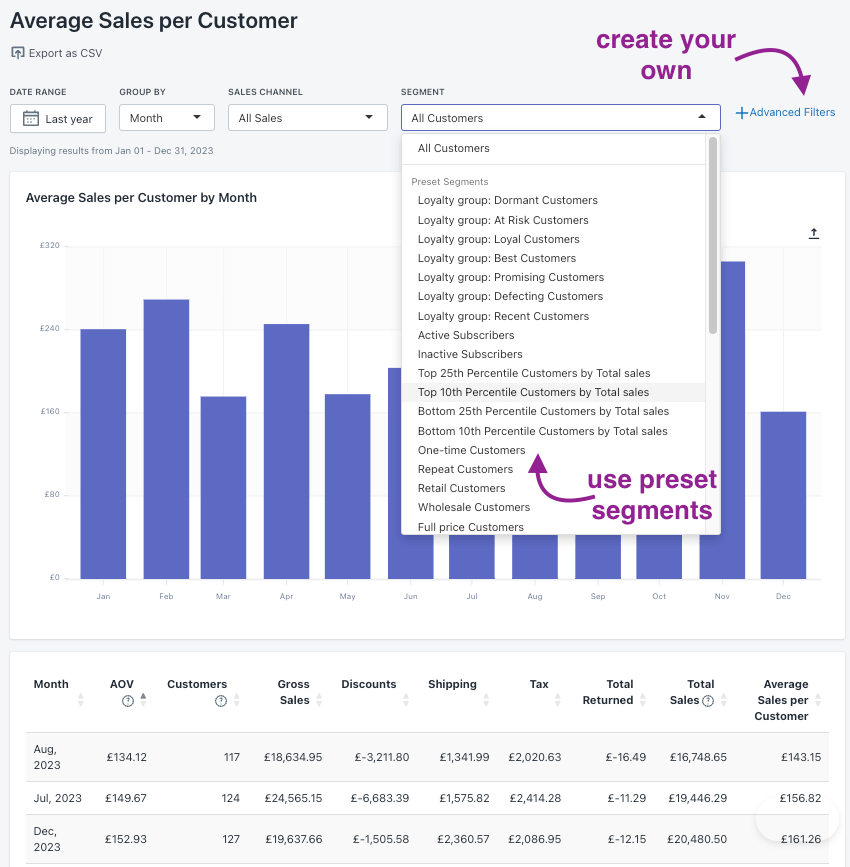
By the Numbers shows regular filtering capabilities by date, range, sales channel, and segment. However, this report also allows you to group your results by hour, day, week, month, quarter, and year, giving you adapted results for each.
Imagine the potential of segmenting your audience and launching personalized campaigns. By grouping customers with similar characteristics, you can engage them more personally. Why not target only your top-tier spenders with an upsell campaign? This is just the beginning; the more creative you get, the more you can boost your sales. By the Numbers app allows for custom segmentation and app integrations, giving you the tools to convert your innovative ideas into reality.
After that, a By the Numbers user would use the app integrations (Klaviyo, Google Ads, TikTok Ads and Meta) to launch an upsell campaign and incorporate the data provided by these platforms into BtN’s reports.
Let’s talk a little bit about BtN’s two main features:
Custom Segmentation
With By the Numbers, you can create your custom segments. These are groups of customers who share similar characteristics, such as their purchase history, that you can use more effectively to understand your customers better.
Using the preset segments and creating personalized ones is far from complicated:
1- Access By the Numbers and locate the segments section on the left-hand menu. Click on it, and you’ll see Preset Segments and Custom Segments.
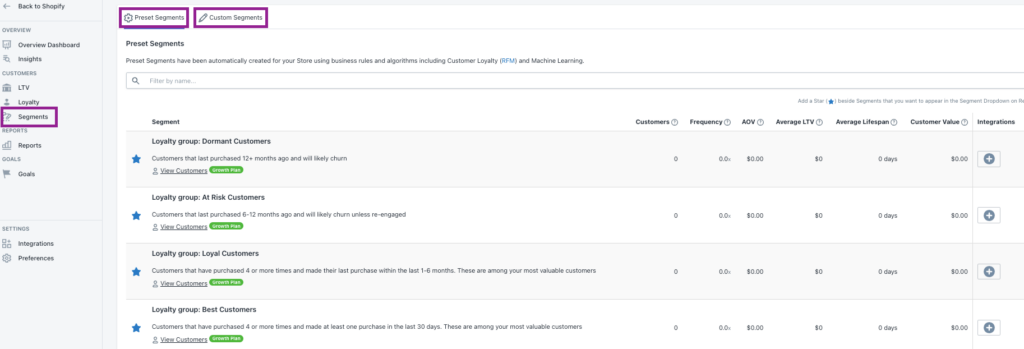
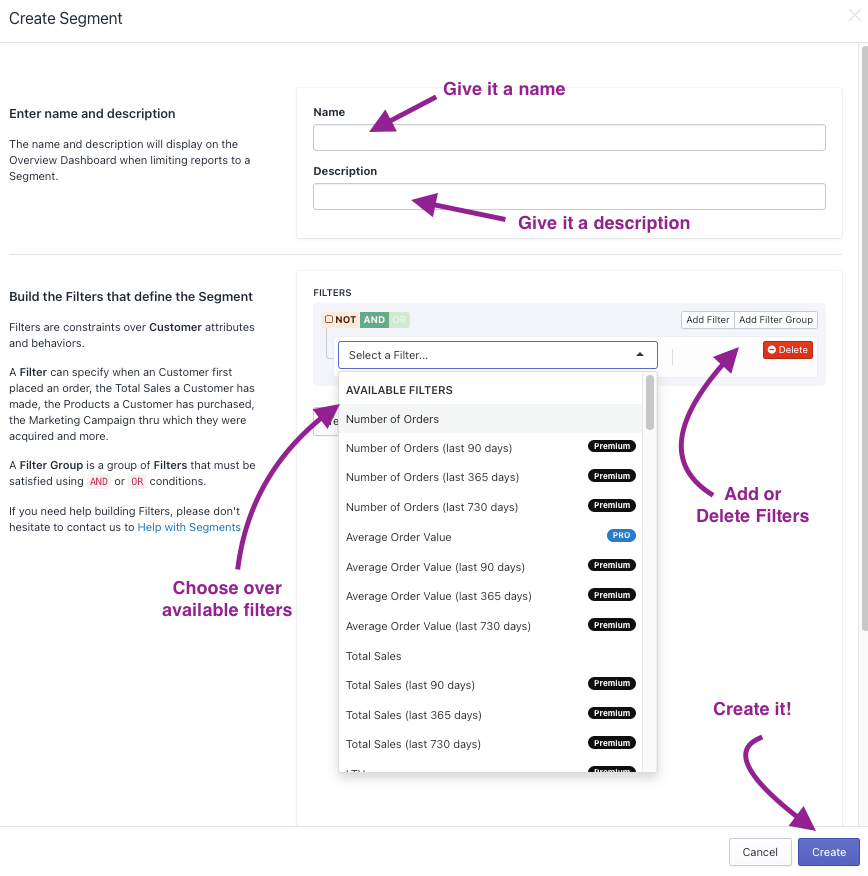
2- If you navigate to the top right corner, you’ll find the ‘Create Segment’ button. Click on it, and a new window will appear. You’ll be able to pick the filters and create your segment there.
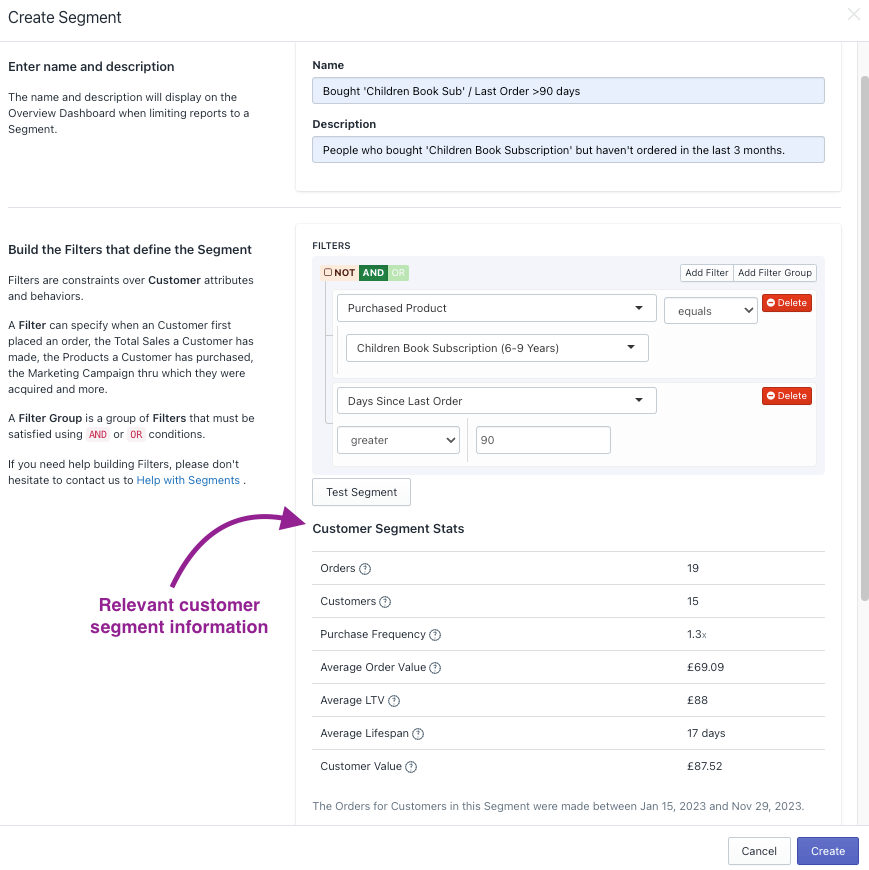
There is only one thing left to do. Click on ‘test your segment’ to make sure it’s functional. This will also supply you with relevant customer segment data, which you’ll see in the following image.
By the Numbers App Integrations
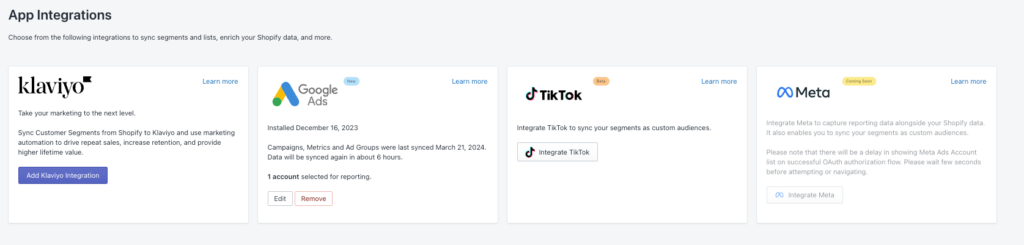
By the Numbers has another important feature: integrating seamlessly with Klaviyo, Google Ads, TikTok Ads, and Meta. This means you can engage the customers who populate your segments in personalized campaigns through the abovementioned platforms. You can trust that the data gathered by these platforms and incorporated into your reports will be accurate and reliable, giving you a secure foundation for your decisions.
For example, you could use By the Numbers to find customers who spent below the average order value and target them through an upsell campaign. This could involve offering them a discount on a higher-priced item or suggesting additional products that complement their purchase. The possibilities are endless, and By the Numbers can help you identify these opportunities and take action to increase your sales.
For this, you just need a few clicks:
1- Access By the Numbers and locate ‘Integrations’ in the settings section’s left-hand menu.
2- Pick the integration you want to incorporate and follow the guidelines.
By leveraging By the Numbers, you can optimize your budget, identify customers who spend less than average, and retarget them through Klaviyo, Google Ads, TikTok and Meta. Incorporate the data into your reports and use BtN’s insights to boost your sales. The possibilities are endless, so start exploring today!
Get a free demo by a Shopify data expert and see what all the fuss is about!
READY TO TAKE YOUR BUSINESS TO THE NEXT LEVEL?
Or get started with a Start A Free Trial